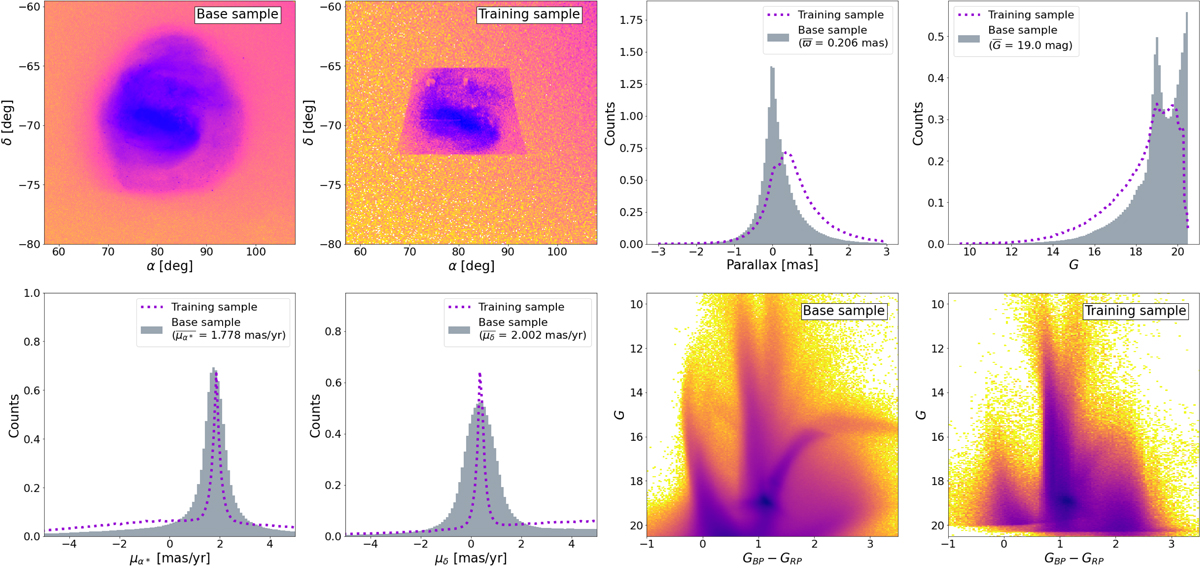
Fig. 2.
Download original image
Comparison between the Gaia base and training samples. Top from left to right: density distribution in equatorial coordinates of the Gaia base and Gaia training samples in logarithmic scale, parallax, and G magnitude distributions. Bottom from left to right: proper motion distributions in right ascension and declination and colour-magnitude diagrams for the Gaia base and training samples. In the histograms, in gray we show the Gaia base sample, while in dotted purple we show the Gaia training sample. In the color-magnitude diagrams, colors represent relative stellar density with darker colors meaning higher densities.
Current usage metrics show cumulative count of Article Views (full-text article views including HTML views, PDF and ePub downloads, according to the available data) and Abstracts Views on Vision4Press platform.
Data correspond to usage on the plateform after 2015. The current usage metrics is available 48-96 hours after online publication and is updated daily on week days.
Initial download of the metrics may take a while.