Fig. 15.
Download original image
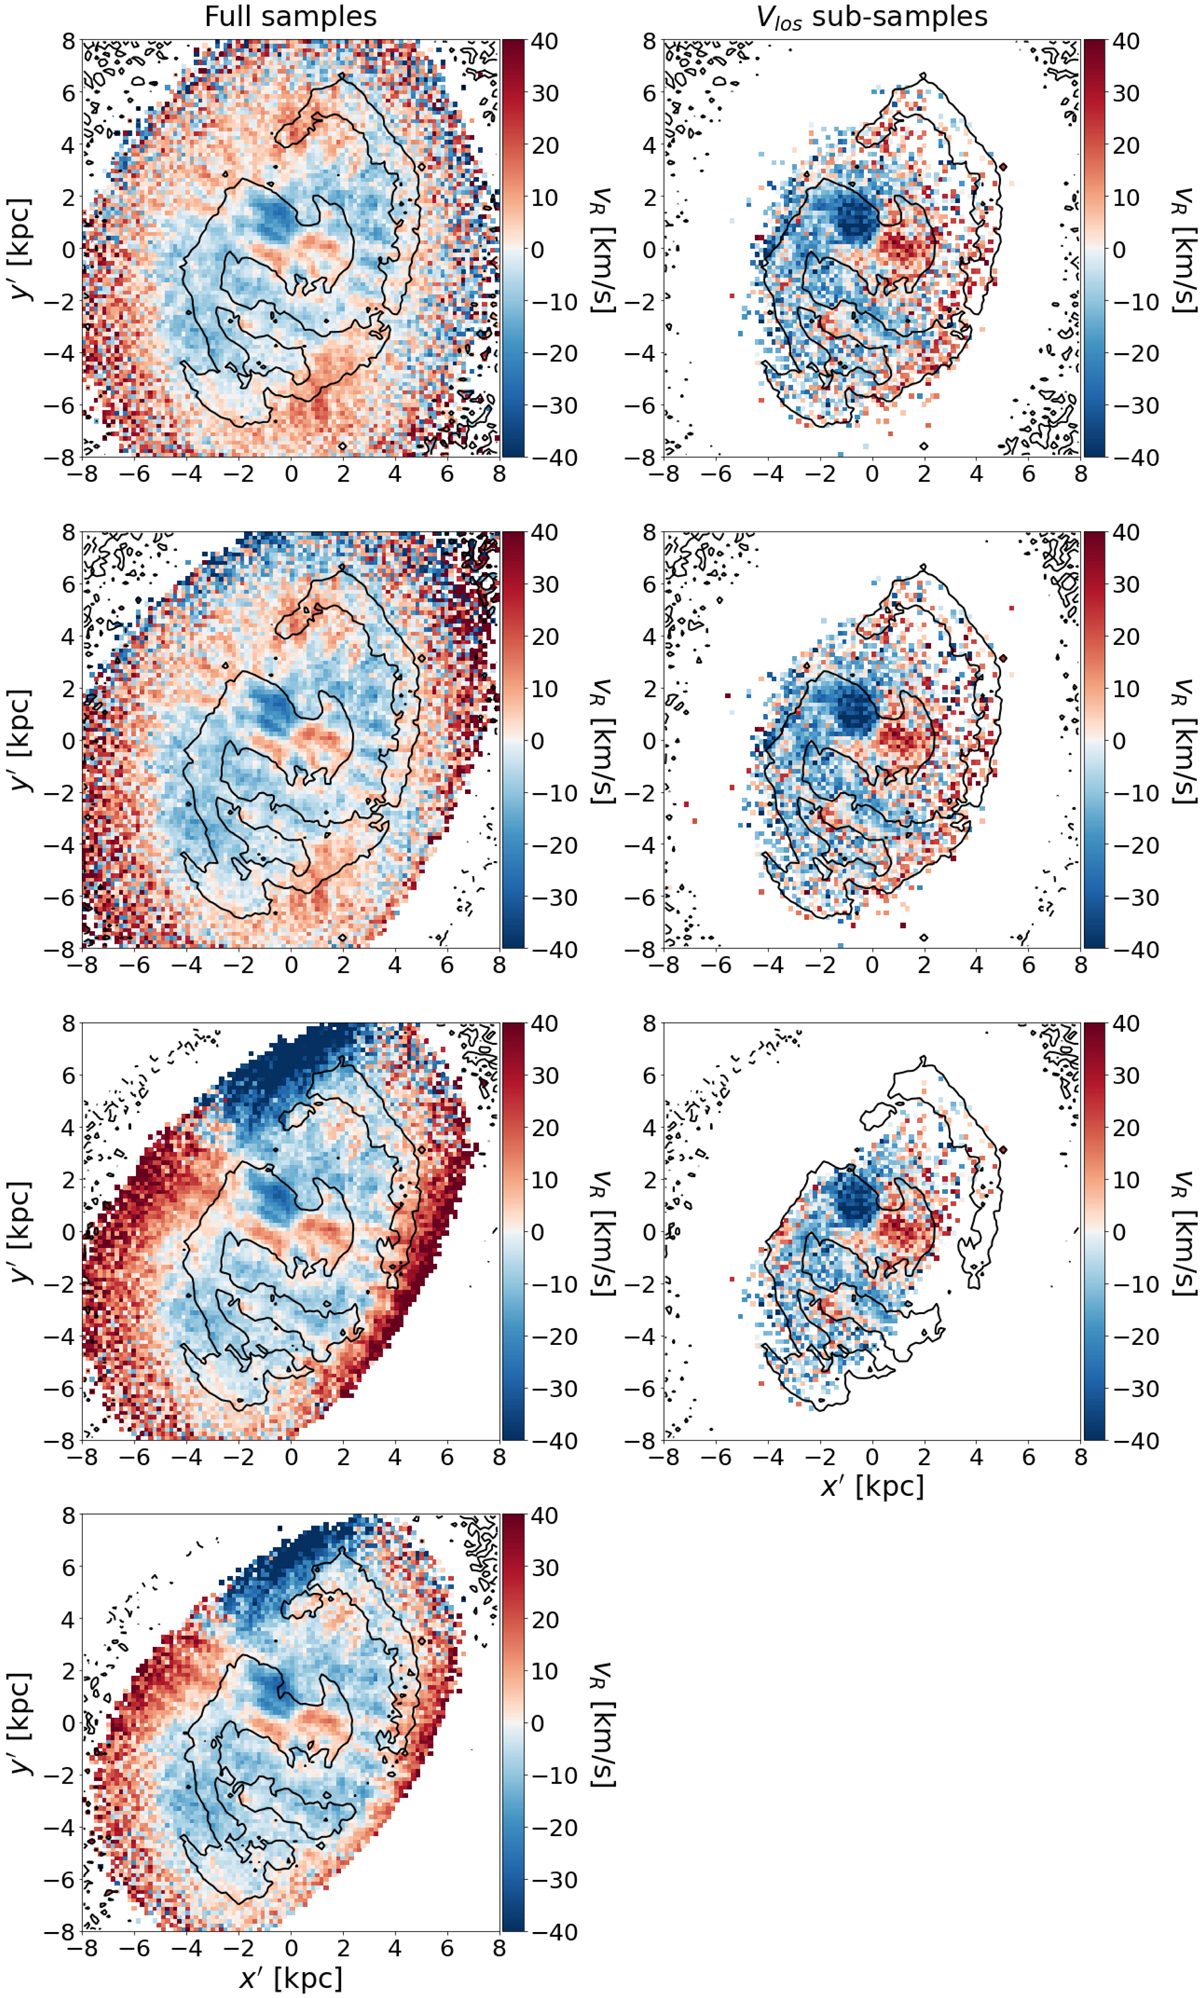
LMC median radial velocity maps. All maps are shown in the (x′,y′) Cartesian coordinate system. From top to bottom: PM sample, NN complete, NN optimal, and NN truncated-optimal sample. Left: line-of-sight velocity not included. Right: line of sight velocity included. NN truncated-optimal Vlos sub-sample map is not shown because it is the same as the NN optimal Vlos sub-sample (see text for details). For each colormap, a black line splitting the overdensities from the underdensities for a 0.4 kpc-bandwidth KDE is plotted and a minimum number of 3 (20) stars per bin is imposed when the line-of-sight is (not) considered.
Current usage metrics show cumulative count of Article Views (full-text article views including HTML views, PDF and ePub downloads, according to the available data) and Abstracts Views on Vision4Press platform.
Data correspond to usage on the plateform after 2015. The current usage metrics is available 48-96 hours after online publication and is updated daily on week days.
Initial download of the metrics may take a while.