Fig. 13.
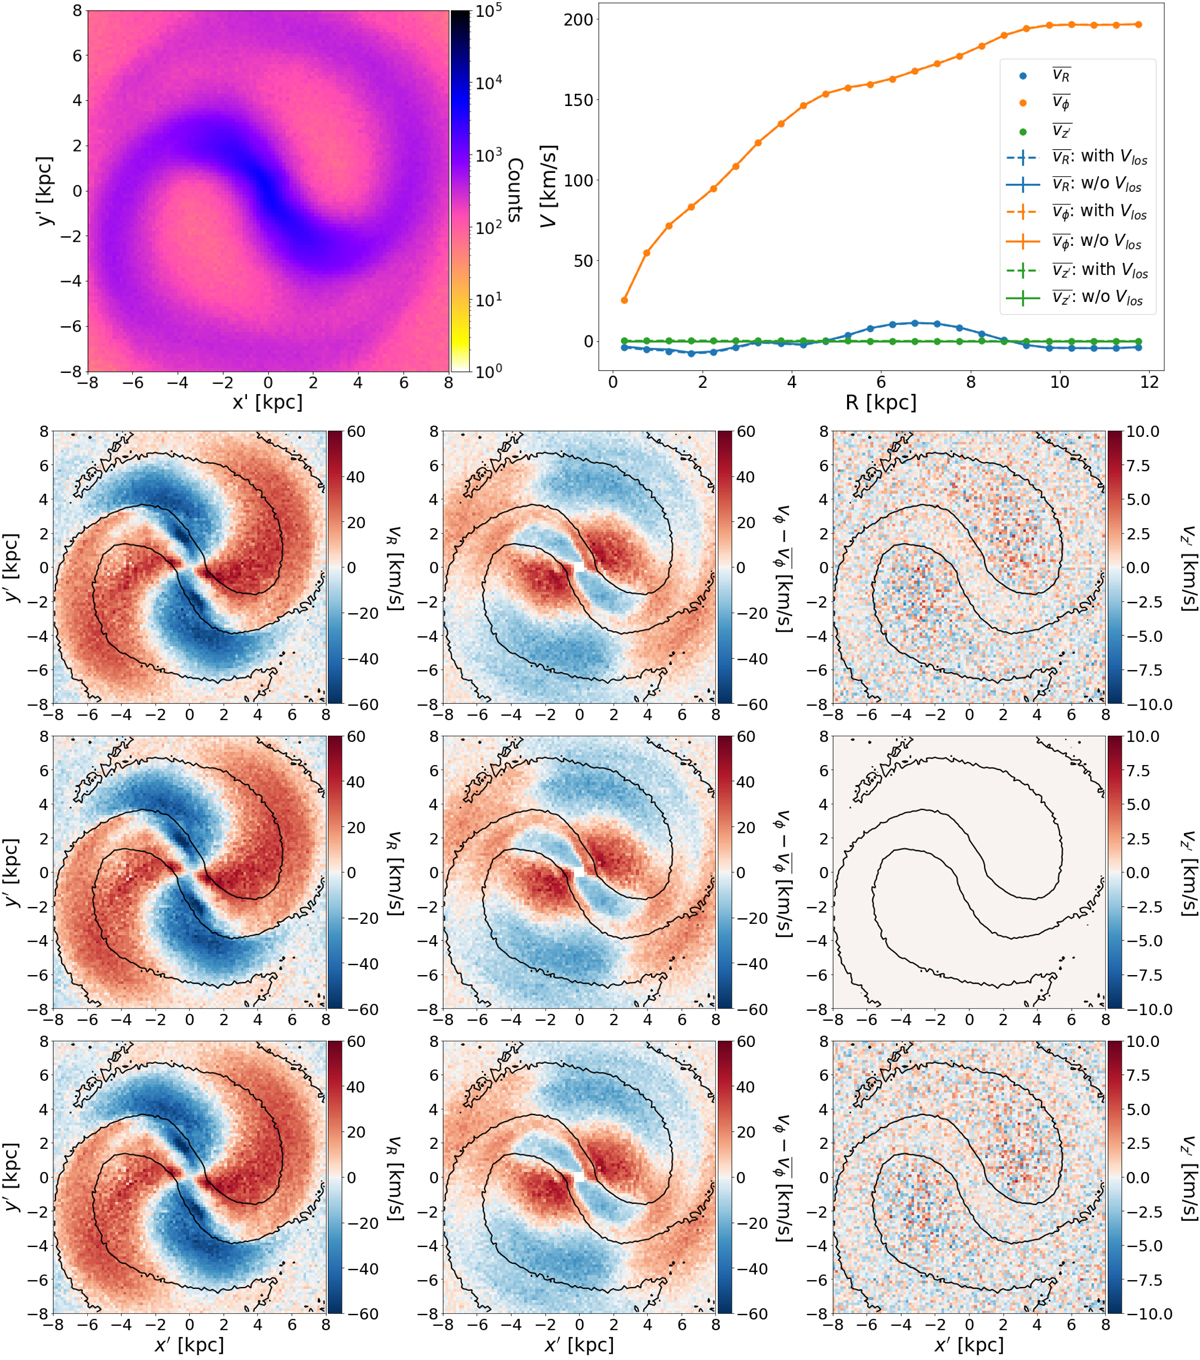
Download original image
Simulation B5. First row left panel: density distribution in logarithmic scale. First row, right panel: velocity profiles of the B5 simulation. In blue, orange and green, for the radial, tangential, and vertical components, respectively, when taking into account the full velocity information (dashed lines), or when Vlos is not available (solid lines). Differences are negligible and both curves overlap. Scatter points show the real velocity profiles. Second row: N-body simulation maps (left, radial; middle, residual tangential; right, vertical), without applying any coordinate transformation. Third row: same as above computed applying the (Sect. 3) coordinate transformations without line-of-sight information. Fourth row: same as above computed applying the (Sect. 3) coordinate transformations with line-of-sight information. The black line shows the contour corresponding to overdensity equal to zero for a 0.4 kpc-bandwidth KDE (see details in Sect. 4.2).
Current usage metrics show cumulative count of Article Views (full-text article views including HTML views, PDF and ePub downloads, according to the available data) and Abstracts Views on Vision4Press platform.
Data correspond to usage on the plateform after 2015. The current usage metrics is available 48-96 hours after online publication and is updated daily on week days.
Initial download of the metrics may take a while.