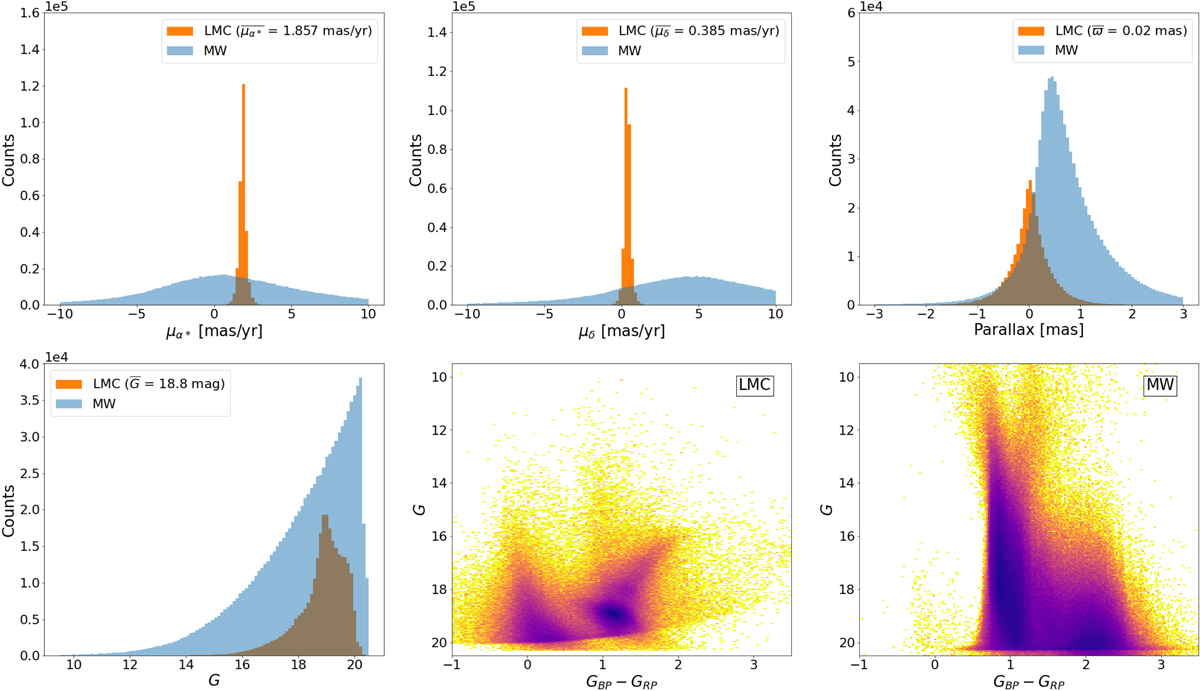
Fig. 1.
Download original image
Characteristics of the GOG simulated samples. Top left and middle: distribution of proper motions in right ascension and declination, respectively. In orange and blue: LMC and the MW training samples. Top right: parallax distribution. Bottom left: magnitude G distribution of the simulated samples. Bottom middle and right: colour-magnitude diagram of the LMC and MW, respectively. Colors represent relative stellar density, with darker colors meaning higher densities.
Current usage metrics show cumulative count of Article Views (full-text article views including HTML views, PDF and ePub downloads, according to the available data) and Abstracts Views on Vision4Press platform.
Data correspond to usage on the plateform after 2015. The current usage metrics is available 48-96 hours after online publication and is updated daily on week days.
Initial download of the metrics may take a while.