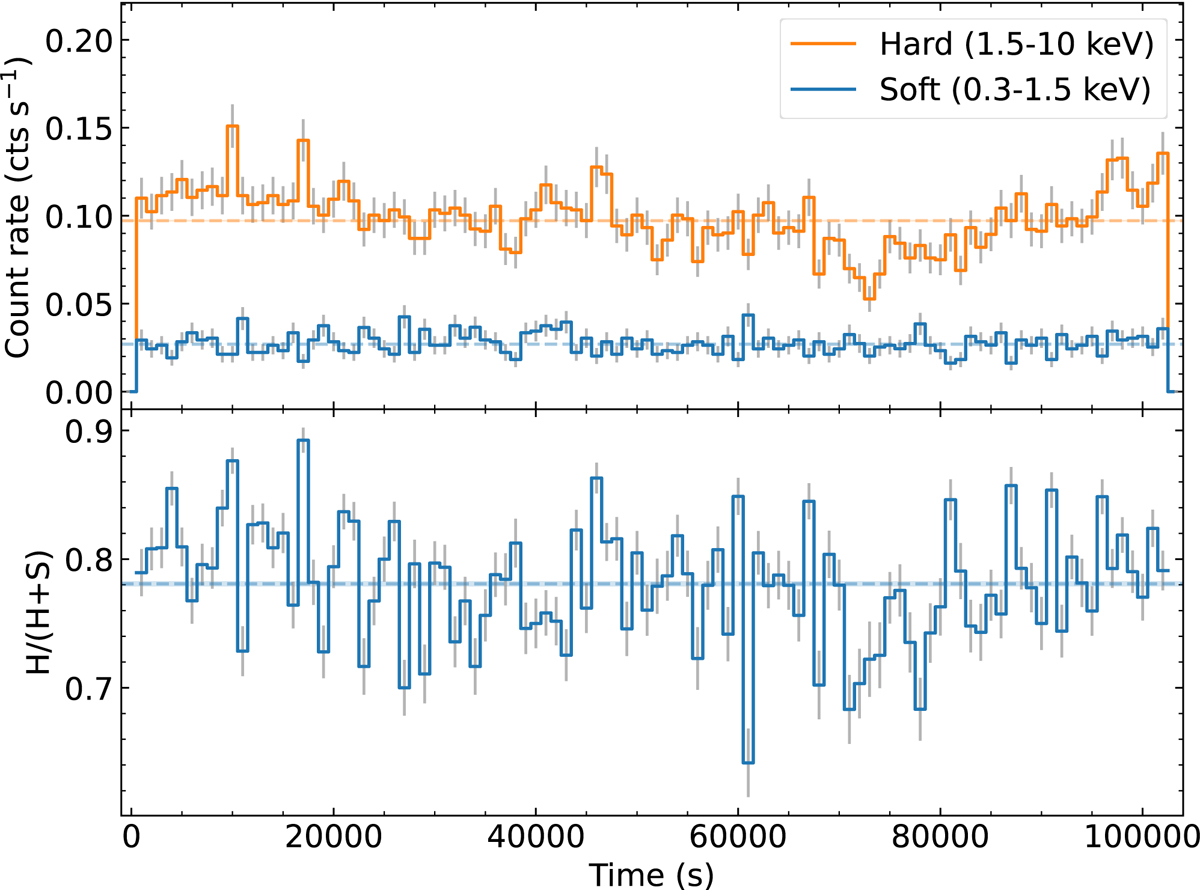
Fig. 5.
Download original image
Light curves and HR of Chandra ObsID 18047. Top panel: light curves in the hard (orange) and soft (blue) energy bands, binned at 1000 s, with dashed lines representing the mean count rate of each light curve. Bottom panel: HR, computed as the number of counts in the hard band divided by the total number of counts. The dashed line corresponds to the mean HR.
Current usage metrics show cumulative count of Article Views (full-text article views including HTML views, PDF and ePub downloads, according to the available data) and Abstracts Views on Vision4Press platform.
Data correspond to usage on the plateform after 2015. The current usage metrics is available 48-96 hours after online publication and is updated daily on week days.
Initial download of the metrics may take a while.