Open Access
Fig. 3.
Download original image
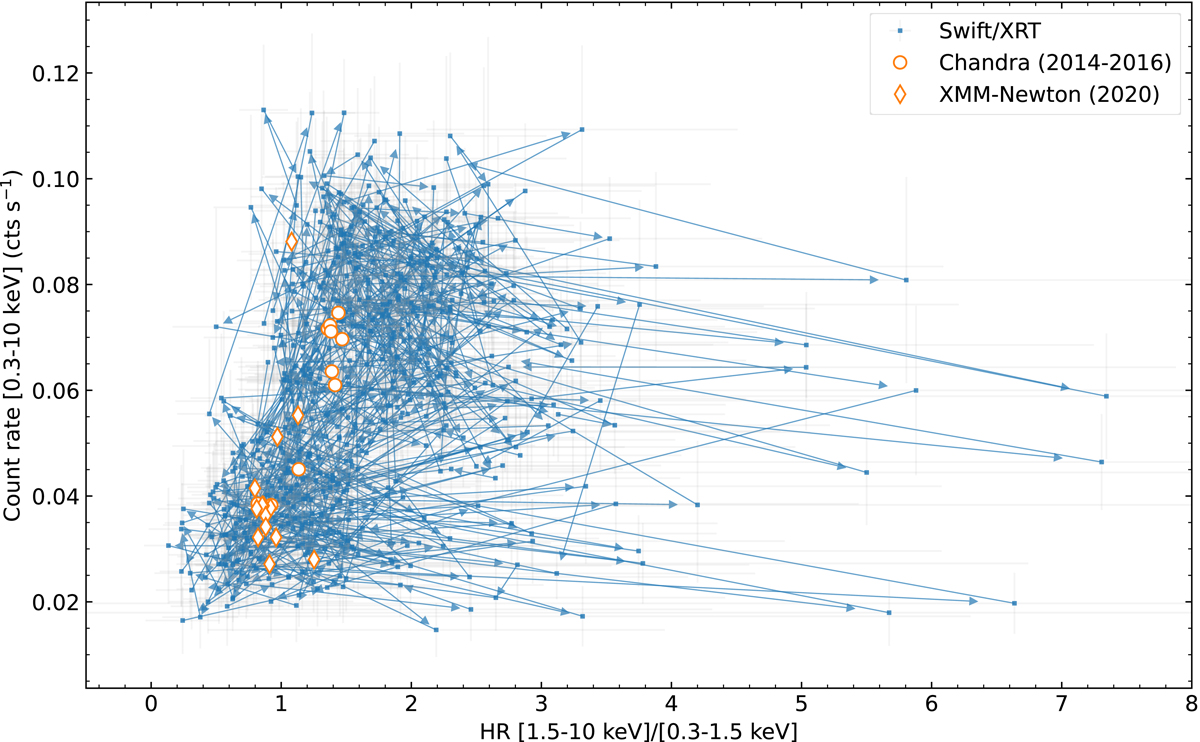
Evolution of Swift/XRT broadband count rates (blue dots) as a function of the HR, in comparison with the latest Chandra (empty orange circles) and XMM-Newton data (empty orange diamonds). Data from different XMM-Newton-EPIC instruments are plotted individually. Errors on Chandra and XMM-Newton data are not shown.
Current usage metrics show cumulative count of Article Views (full-text article views including HTML views, PDF and ePub downloads, according to the available data) and Abstracts Views on Vision4Press platform.
Data correspond to usage on the plateform after 2015. The current usage metrics is available 48-96 hours after online publication and is updated daily on week days.
Initial download of the metrics may take a while.