Open Access
Fig. 2.
Download original image
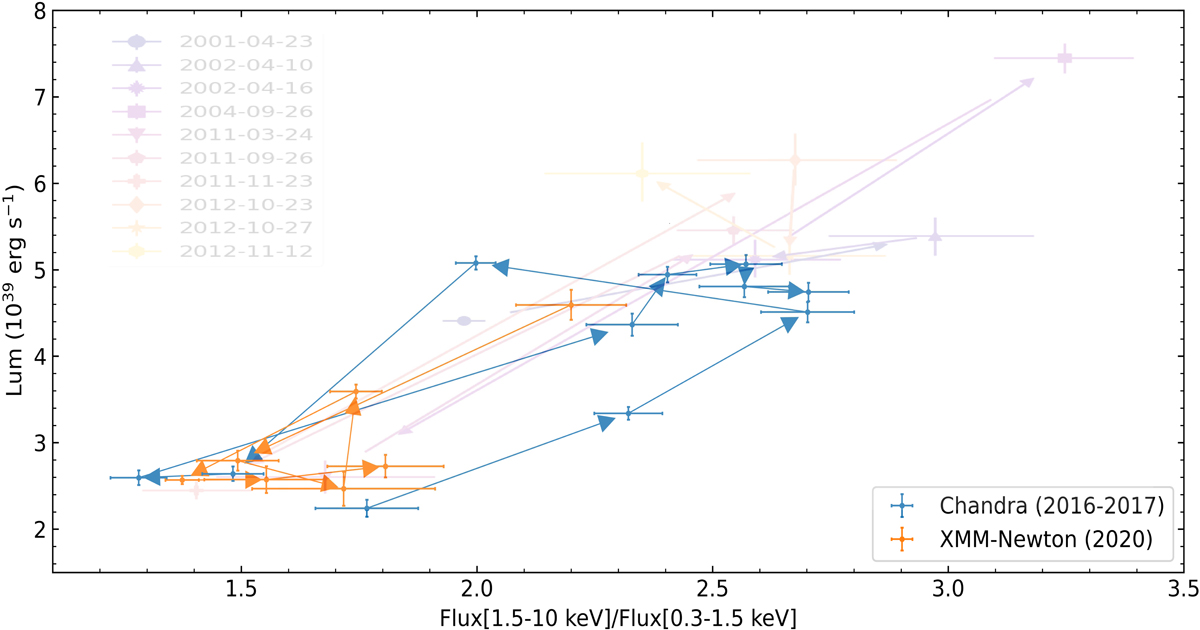
Hardness-intensity diagram (HID) of the Chandra (blue) and 2020 XMM-Newton (orange) datasets, in comparison with the old XMM-Newton observations (fainter text and points) as reported in G21.
Current usage metrics show cumulative count of Article Views (full-text article views including HTML views, PDF and ePub downloads, according to the available data) and Abstracts Views on Vision4Press platform.
Data correspond to usage on the plateform after 2015. The current usage metrics is available 48-96 hours after online publication and is updated daily on week days.
Initial download of the metrics may take a while.