Fig. 1.
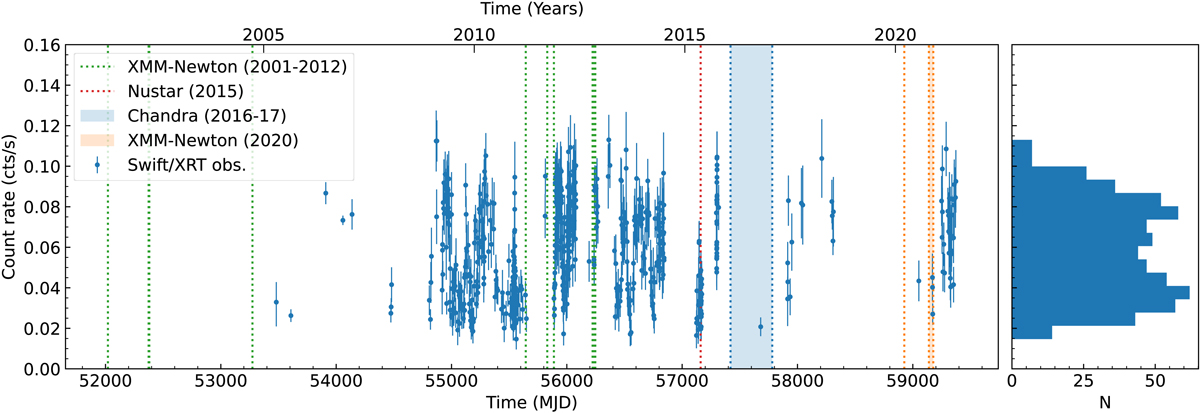
Download original image
Temporal evolution of M 81 X-6. Left panel: Swift/XRT light curve in the 0.3−10 keV energy band. Each data point corresponds to an observation. The time interval spun by the Chandra observations considered in this work is coloured in light blue, while that of the most recent XMM-Newton observations is coloured in light orange or represented by a dotted orange vertical line. The vertical dotted green lines mark the oldest XMM-Newton observations (cf. G21) and the red one the NuSTAR observation used in this work. Right panel: histogram of Swift/XRT count rates, showing a clear bimodal distribution.
Current usage metrics show cumulative count of Article Views (full-text article views including HTML views, PDF and ePub downloads, according to the available data) and Abstracts Views on Vision4Press platform.
Data correspond to usage on the plateform after 2015. The current usage metrics is available 48-96 hours after online publication and is updated daily on week days.
Initial download of the metrics may take a while.