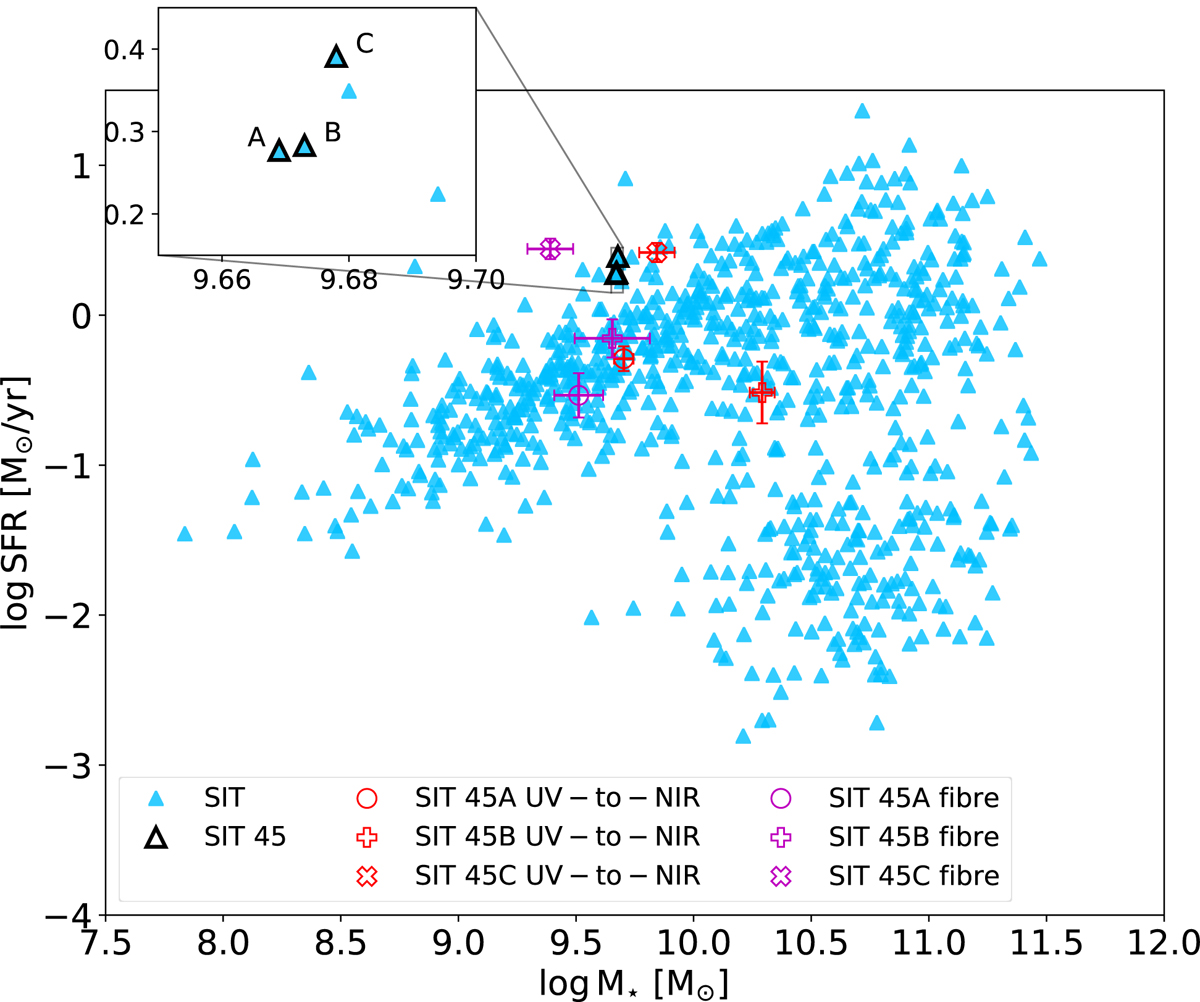
Fig. 5.
Download original image
Diagram of log(SFR) vs. log(M⋆) for SIT galaxies in the GSWLC-M2 catalogue by Salim et al. (2018, light blue triangles). The corresponding values for the galaxies in SIT 45 in this catalogue are represented by open black triangles. A zoomed-in image is provided (see inset) to better identify the corresponding values. The values of the SFR and M⋆ for galaxies SIT 45A, SIT 45B, and SIT 45C using SED fitting from the UV to the IR in this work are represented by red open markers according to the legend, with their corresponding errors (red error bars). We also show the values of the SFR and M⋆ using SED fitting combining fibre photometry and spectra from the SDSS using magenta open markers according to the legend, with their corresponding errors (magenta error bars).
Current usage metrics show cumulative count of Article Views (full-text article views including HTML views, PDF and ePub downloads, according to the available data) and Abstracts Views on Vision4Press platform.
Data correspond to usage on the plateform after 2015. The current usage metrics is available 48-96 hours after online publication and is updated daily on week days.
Initial download of the metrics may take a while.