Open Access
Fig. 4.
Download original image
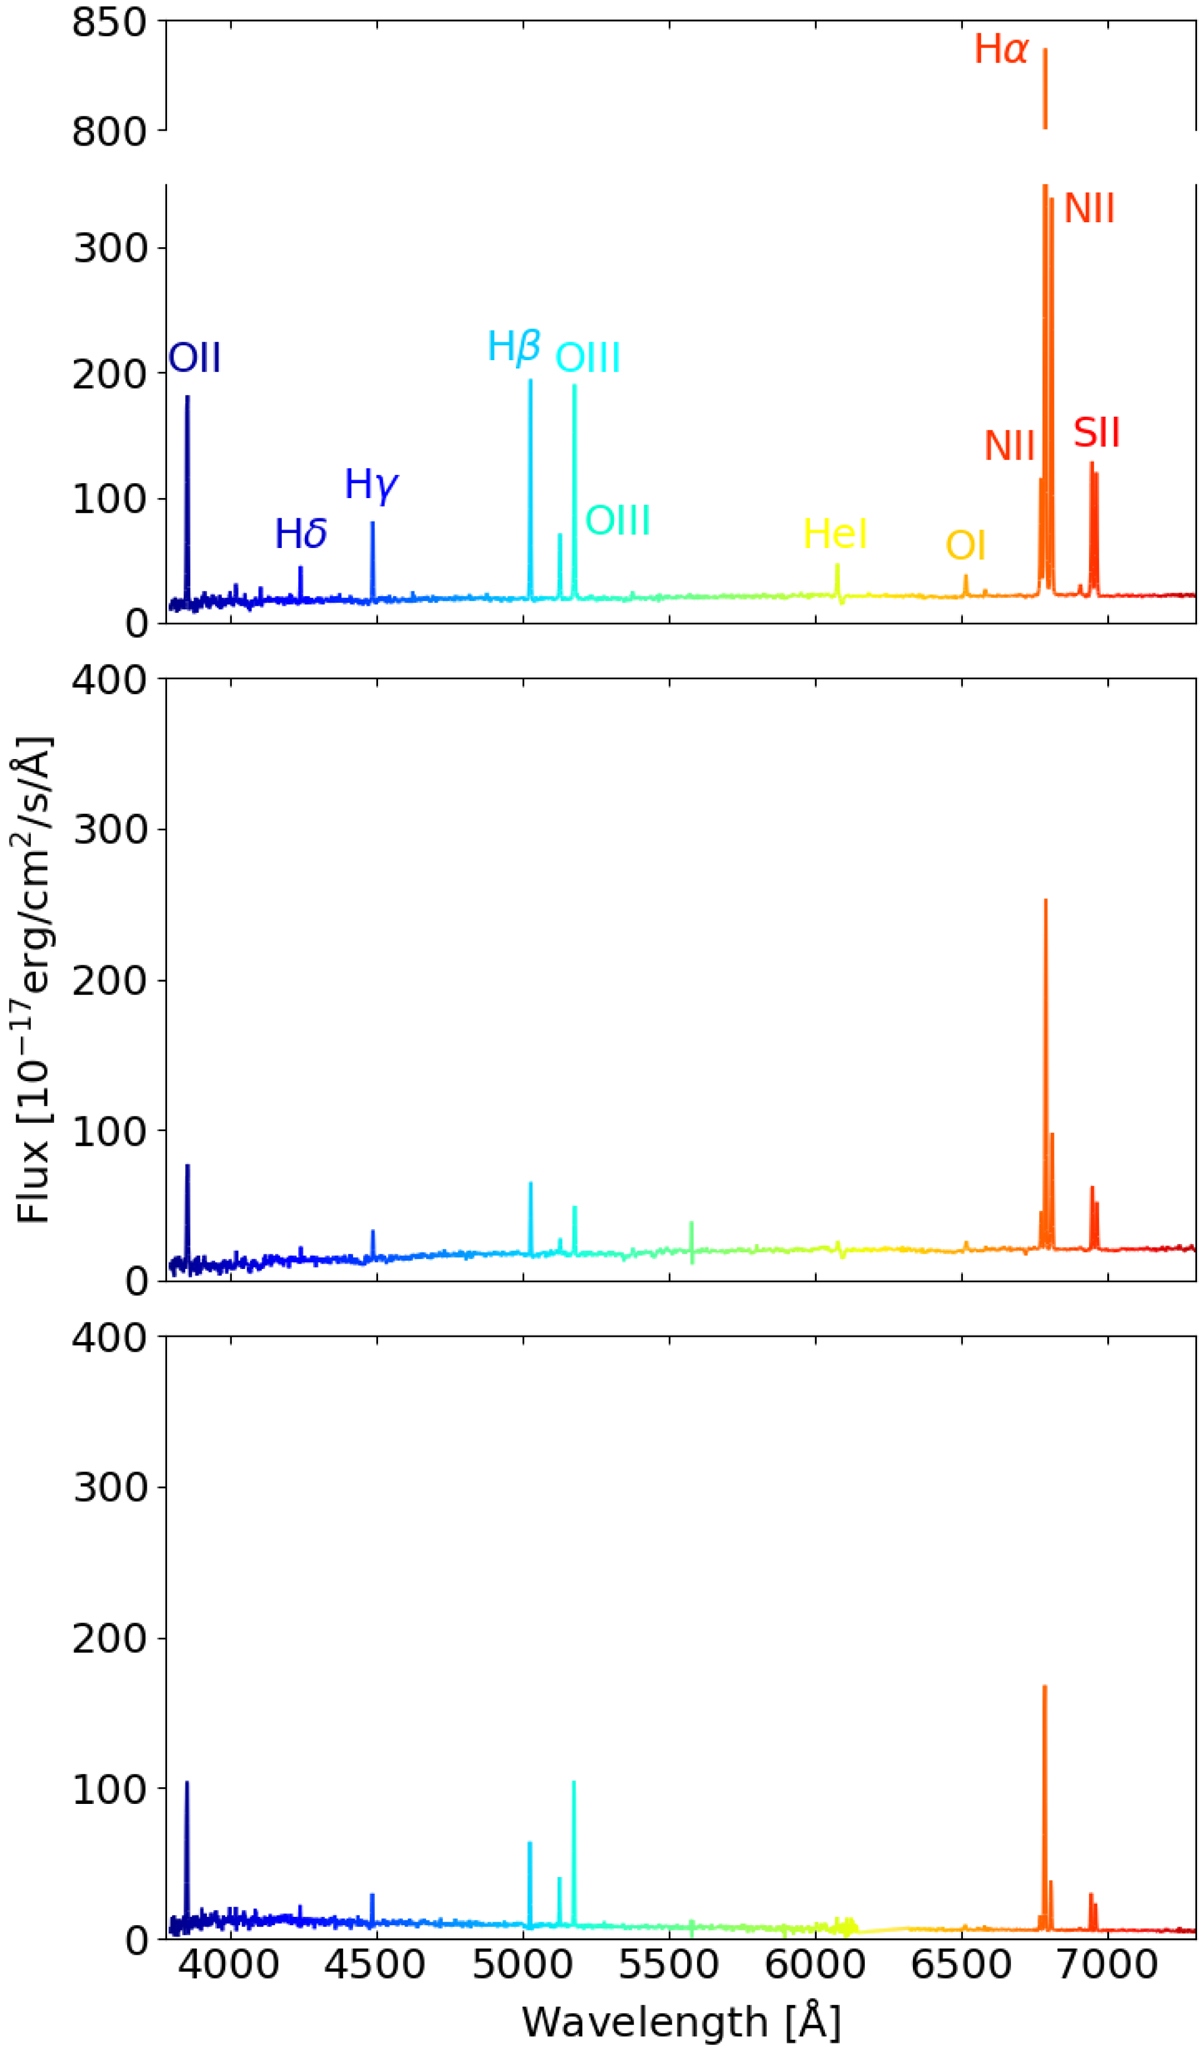
SDSS optical spectra of the central region of the galaxies composing SIT 45. Each spectrum is shown for galaxy A, B, and C (from top to bottom). Spectra are cut at 7500 Å to better show the identified emission lines.
Current usage metrics show cumulative count of Article Views (full-text article views including HTML views, PDF and ePub downloads, according to the available data) and Abstracts Views on Vision4Press platform.
Data correspond to usage on the plateform after 2015. The current usage metrics is available 48-96 hours after online publication and is updated daily on week days.
Initial download of the metrics may take a while.