Fig. 8
Download original image
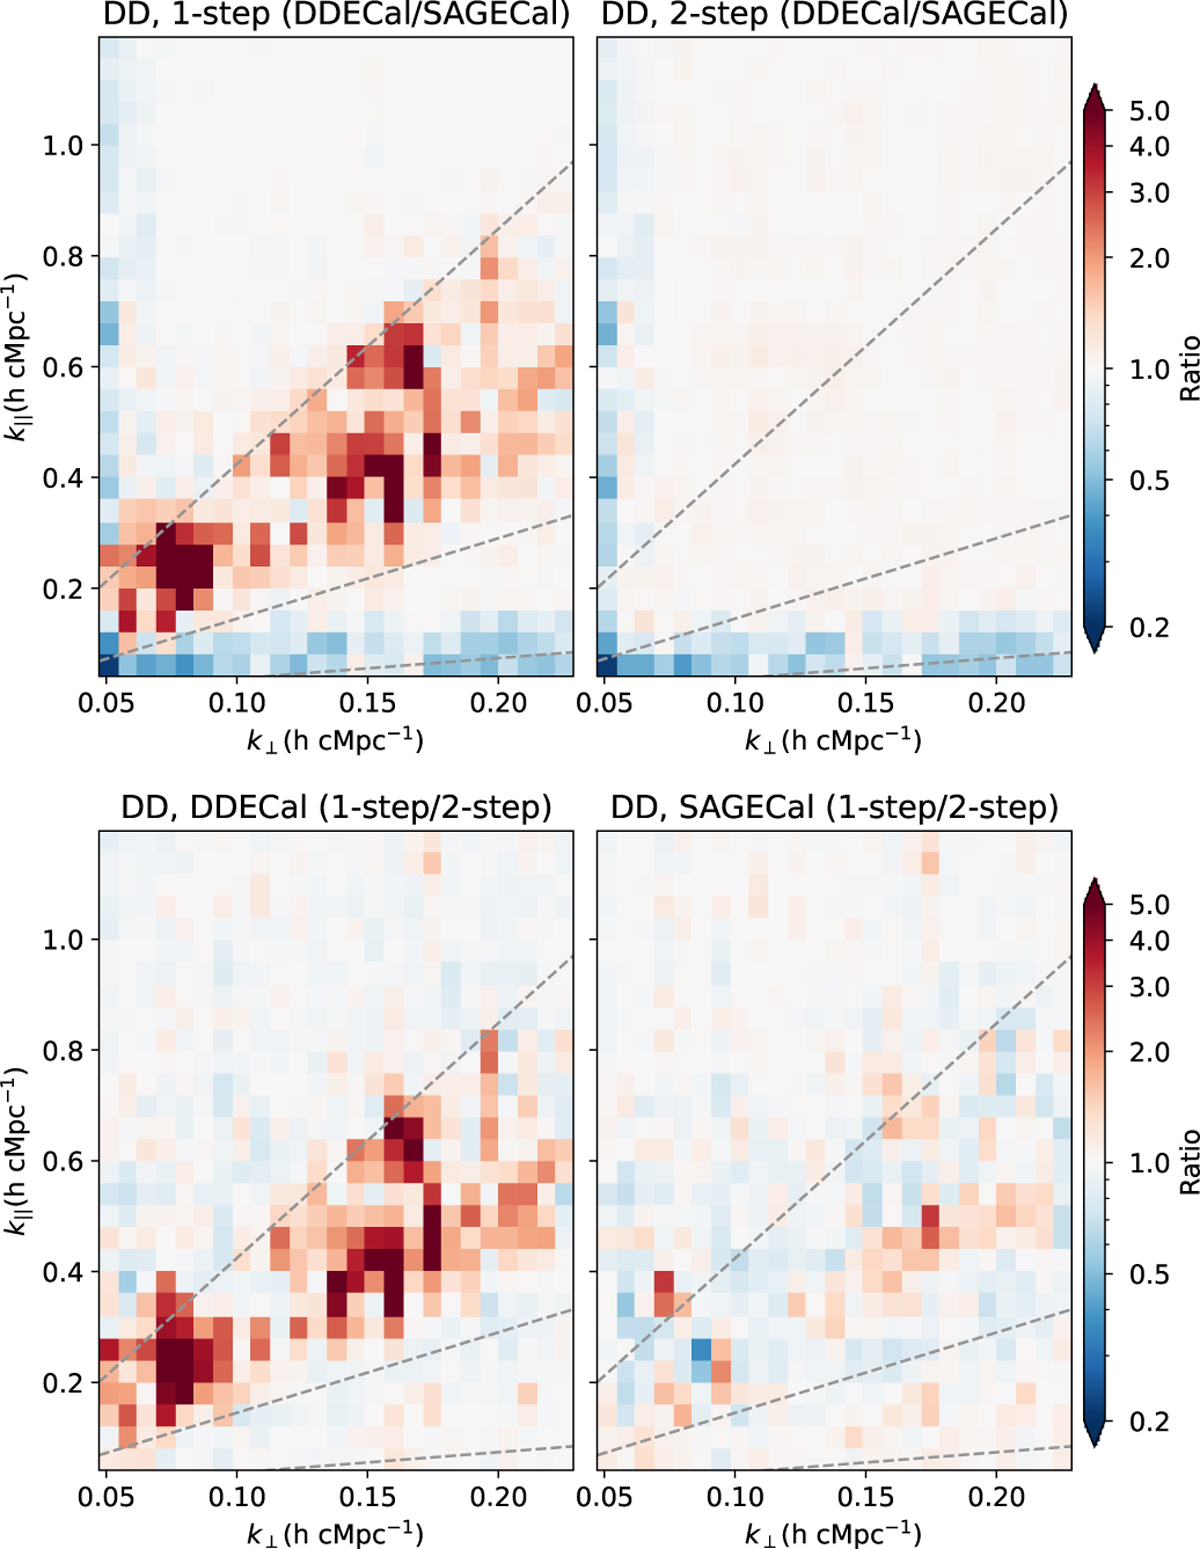
Cylindrical Stokes-I power spectra ratio after DD calibration of DDECAL to SAGECAL given a calibration strategy, the one-step or two-step method (top), and of the one-step to two-step methods given a DD calibration algorithm, DDECAL or SAGECAL (on bottom). The dashed lines indicate the 5° (primary beam), 20°, and 90° (instrumental horizon) delay lines from the phase centre from bottom to top. Top: red indicates excess power from DDECAL and blue indicates excess power from SAGECAL. Bottom: red indicates excess power from the one-step method and blue indicates excess power from the two-step method.
Current usage metrics show cumulative count of Article Views (full-text article views including HTML views, PDF and ePub downloads, according to the available data) and Abstracts Views on Vision4Press platform.
Data correspond to usage on the plateform after 2015. The current usage metrics is available 48-96 hours after online publication and is updated daily on week days.
Initial download of the metrics may take a while.