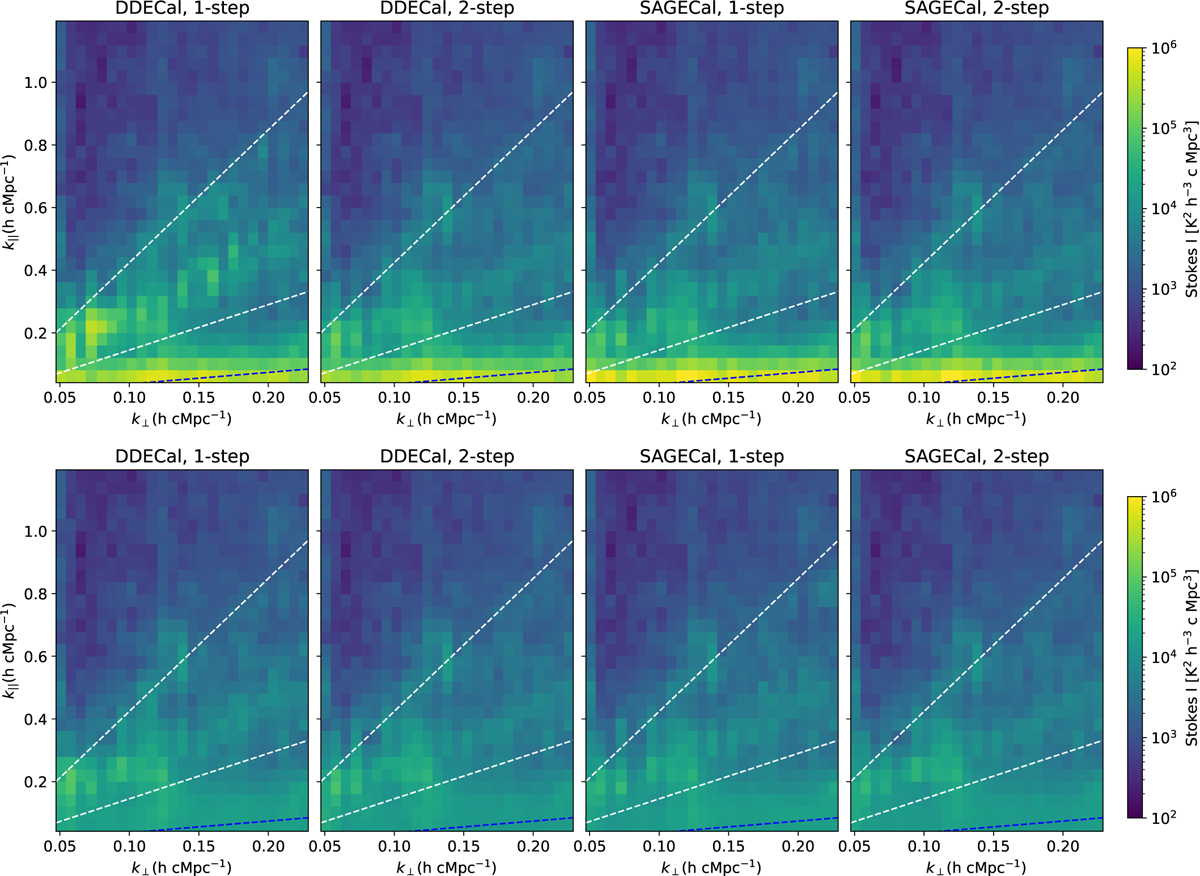
Fig. 7
Download original image
Cylindrical Stokes-I power spectra after DD calibration (top) and GPR foreground removal (bottom) with four DD calibration scenarios using DDECAL and SAGECAL. The dashed lines, from bottom to top, correspond to the 5° (primary beam), 20°, and 90° (instrumental horizon) delay lines from the phase centre. From the top to the bottom row, the GPR foreground removal technique efficiently removes the residual power in the primary beam region. As in the residual images in Fig. 3 (middle and bottom), SAGECAL (last two panels on top) leaves slightly higher power in the primary beam region than DDECAL (first two panels on top) after DD calibration. However, this difference in the primary beam disappears after the application of GPR (bottom). In addition, the power spectrum of DDECAL and one-step method before GPR (first panel on top) has higher residual power between 20° and 90° delay lines compared to the rest, which indicates poor subtraction of Cas A and Cyg A. However, after GPR, the residual Stokes-I power spectra from the four different DD calibration scenarios show very similar results.
Current usage metrics show cumulative count of Article Views (full-text article views including HTML views, PDF and ePub downloads, according to the available data) and Abstracts Views on Vision4Press platform.
Data correspond to usage on the plateform after 2015. The current usage metrics is available 48-96 hours after online publication and is updated daily on week days.
Initial download of the metrics may take a while.