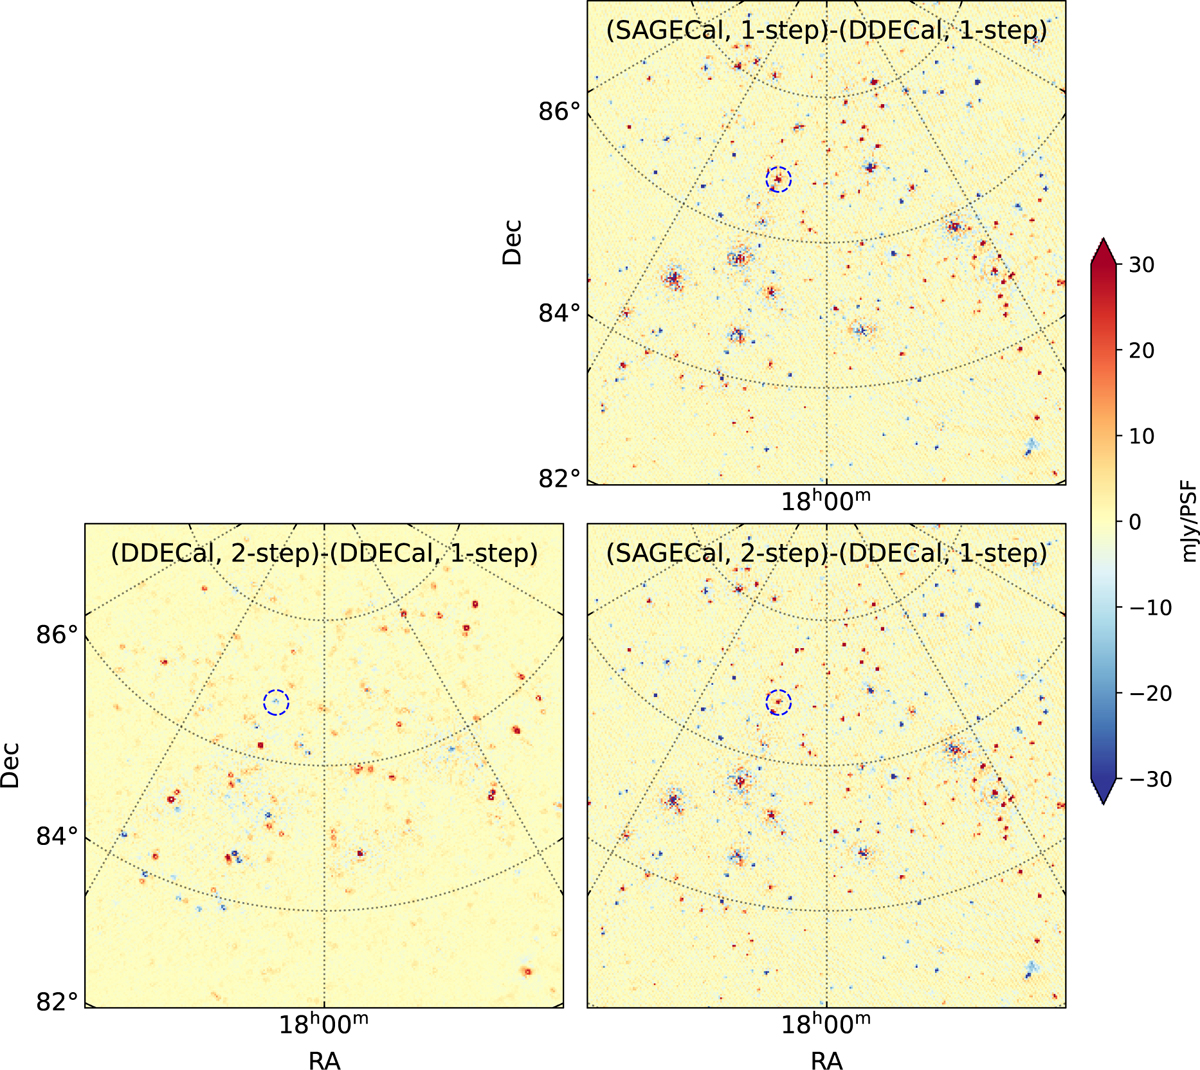
Fig. C.1
Download original image
Difference of LOFAR-HBA 5° × 5° Stokes-I residual images after DD calibration with different calibration scenarios on the RA 18h flanking field at frequency 113.9–127.1 MHz shown in Fig. 3. The images are created with a pixel size of 0.2 arcmin using baselines 50 – 5000λ, combining 69 sub-bands and a single observation night L612832 (~ 11.6-hour). The residual images with different DD calibration scenarios are subtracted by the residual image of the DDECAL and one-step scenario. A reference source is shown (dashed blue circle), which is identical to the one in Fig. 3 to compare different DD calibration residuals.
Current usage metrics show cumulative count of Article Views (full-text article views including HTML views, PDF and ePub downloads, according to the available data) and Abstracts Views on Vision4Press platform.
Data correspond to usage on the plateform after 2015. The current usage metrics is available 48-96 hours after online publication and is updated daily on week days.
Initial download of the metrics may take a while.