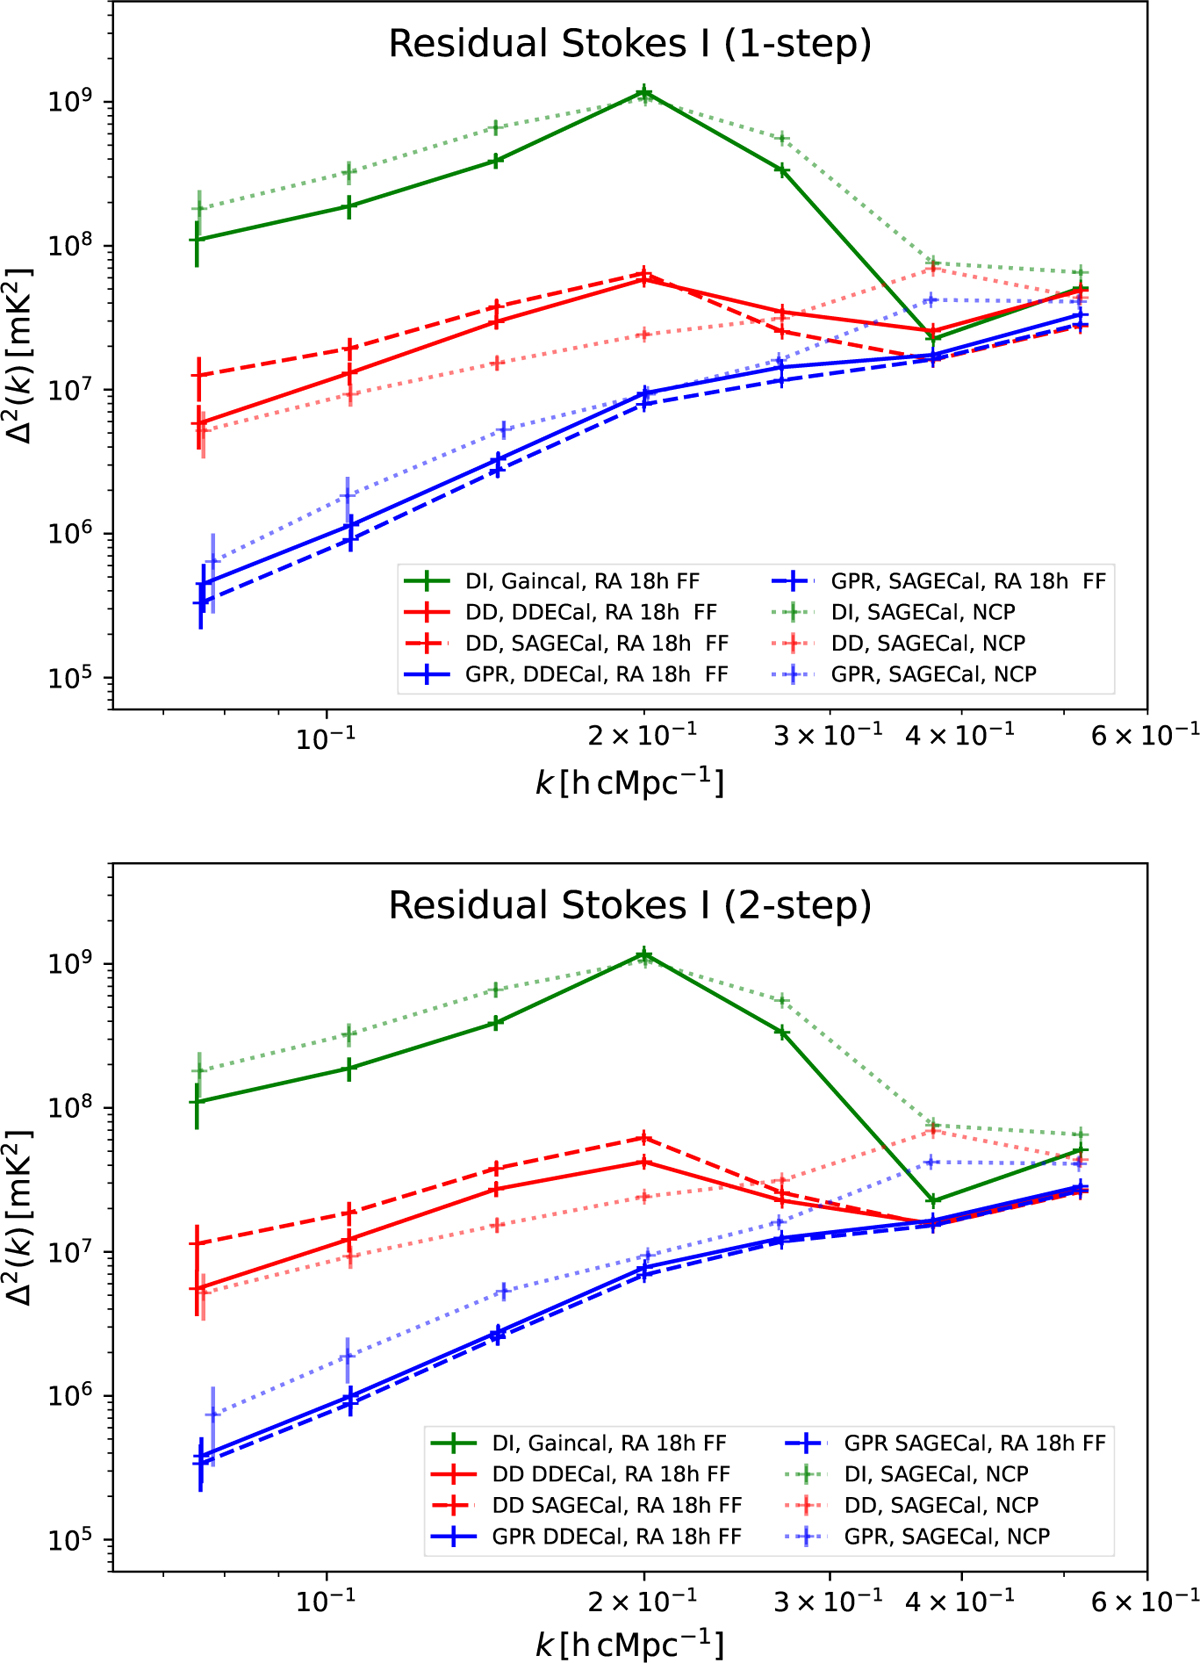
Fig. 12
Download original image
Spherically averaged Stokes-I power spectra on the NCP calibrated by the standard LOFAR-EoR pipeline with SAGECAL (dotted lines) and the RA 18h flanking field calibrated by DDECAL (solid lines) or SAGECAL (dashed lines) with the one-step (top) or two-step (bottom) method. The different colours denote different processing stages. Green, red, and blue denote the Stokes-I power spectra after DI calibration, DD calibration, and GPR foreground removal, respectively. After each calibration stage, the Stokes-I power is reduced significantly. The NCP results show lower power after DD calibration at low k (< 0.3 h cMpc−1) compared to the RA 18h flanking field (in red), due to using an extensive sky model; however, after the GPR foreground removal, the RA 18h flanking field has lower power compared to the NCP (in blue). DDECAL (solid lines) shows better subtraction of sources after DD calibration (in red) compared to SAGECAL (dashed lines) in the one-step and the two-step method, due to the application of the beam model; however, this advantage disappears after GPR (in blue).
Current usage metrics show cumulative count of Article Views (full-text article views including HTML views, PDF and ePub downloads, according to the available data) and Abstracts Views on Vision4Press platform.
Data correspond to usage on the plateform after 2015. The current usage metrics is available 48-96 hours after online publication and is updated daily on week days.
Initial download of the metrics may take a while.