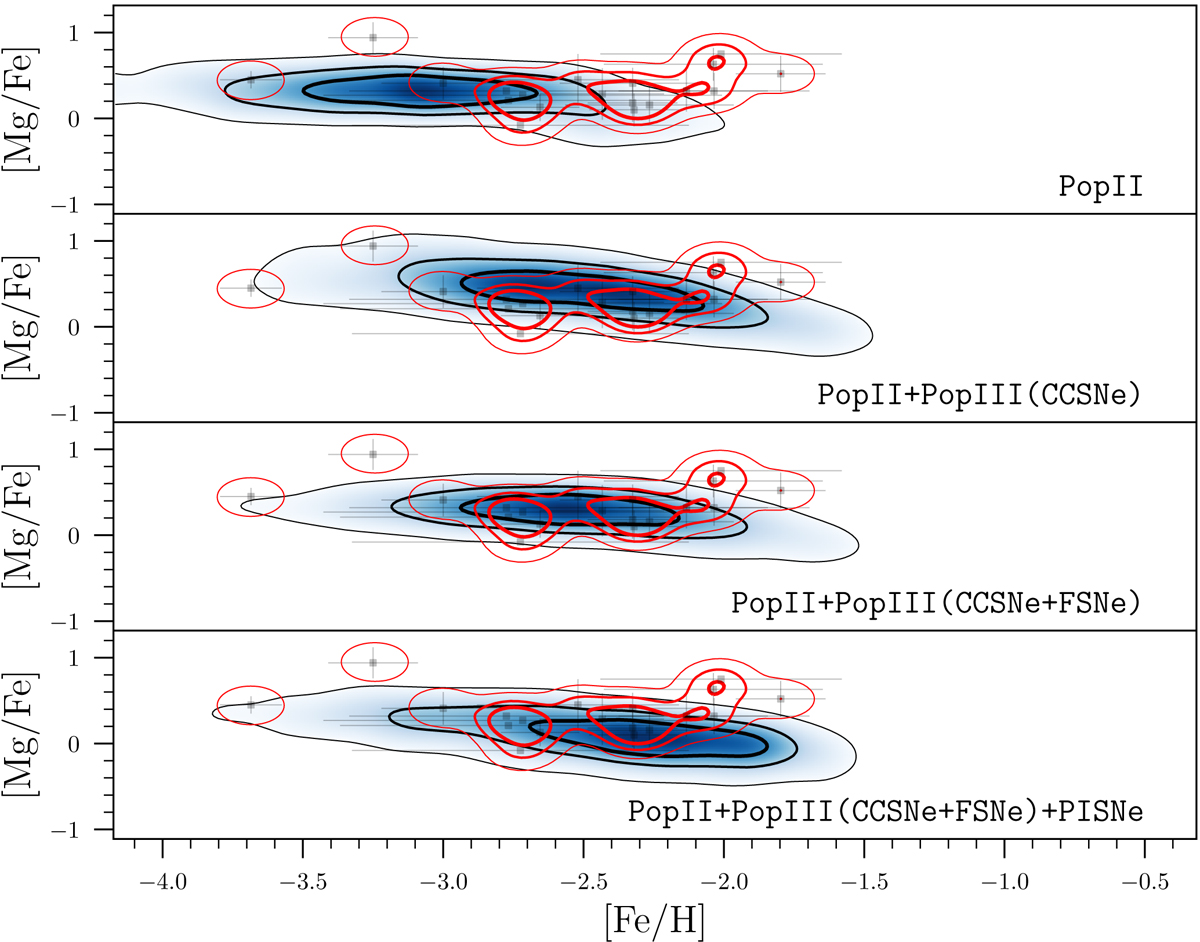
Fig. 9.
Download original image
[Mg/Fe] vs. [Fe/H] for the UFDs with luminosities larger than 104 L⊙, for the models (in blue) and the observations (in gray). Contours, in black for the models and in red for the observations, represent the regions encompassing 30, 60, and 90% of the stars. The data contain a total of 19 stars from Bootes I (Gilmore et al. 2013; Feltzing et al. 2009; Norris et al. 2010b; Ishigaki et al. 2014) and Hercules (Koch et al. 2008; Vargas et al. 2013; François et al. 2016).
Current usage metrics show cumulative count of Article Views (full-text article views including HTML views, PDF and ePub downloads, according to the available data) and Abstracts Views on Vision4Press platform.
Data correspond to usage on the plateform after 2015. The current usage metrics is available 48-96 hours after online publication and is updated daily on week days.
Initial download of the metrics may take a while.