Fig. 8.
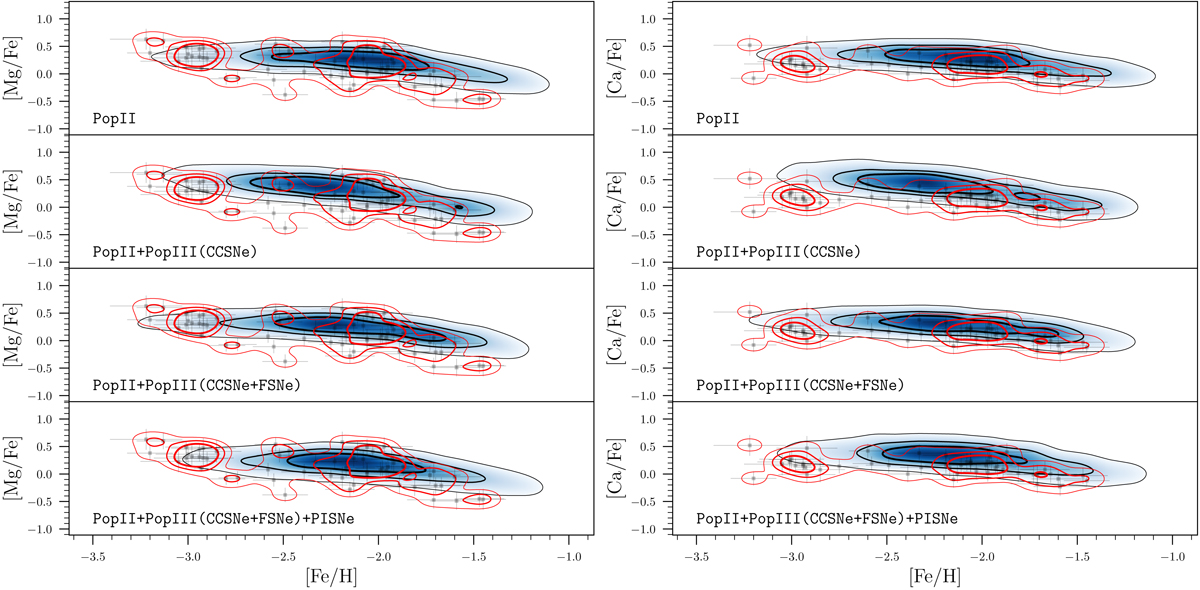
Download original image
[Mg/Fe] and [Ca/Fe] abundance ratios as a function of [Fe/H] for the dwarf spheroidal model (h177). The stellar distribution in blue is compared to the Sextans observations, shown as gray points with error bars. For both simulations and observations, we added contours, shown in black and red, respectively, which represent the regions encompassing 30, 60, and 90% of the stars. The observational data are the same as in Fig. 5.
Current usage metrics show cumulative count of Article Views (full-text article views including HTML views, PDF and ePub downloads, according to the available data) and Abstracts Views on Vision4Press platform.
Data correspond to usage on the plateform after 2015. The current usage metrics is available 48-96 hours after online publication and is updated daily on week days.
Initial download of the metrics may take a while.