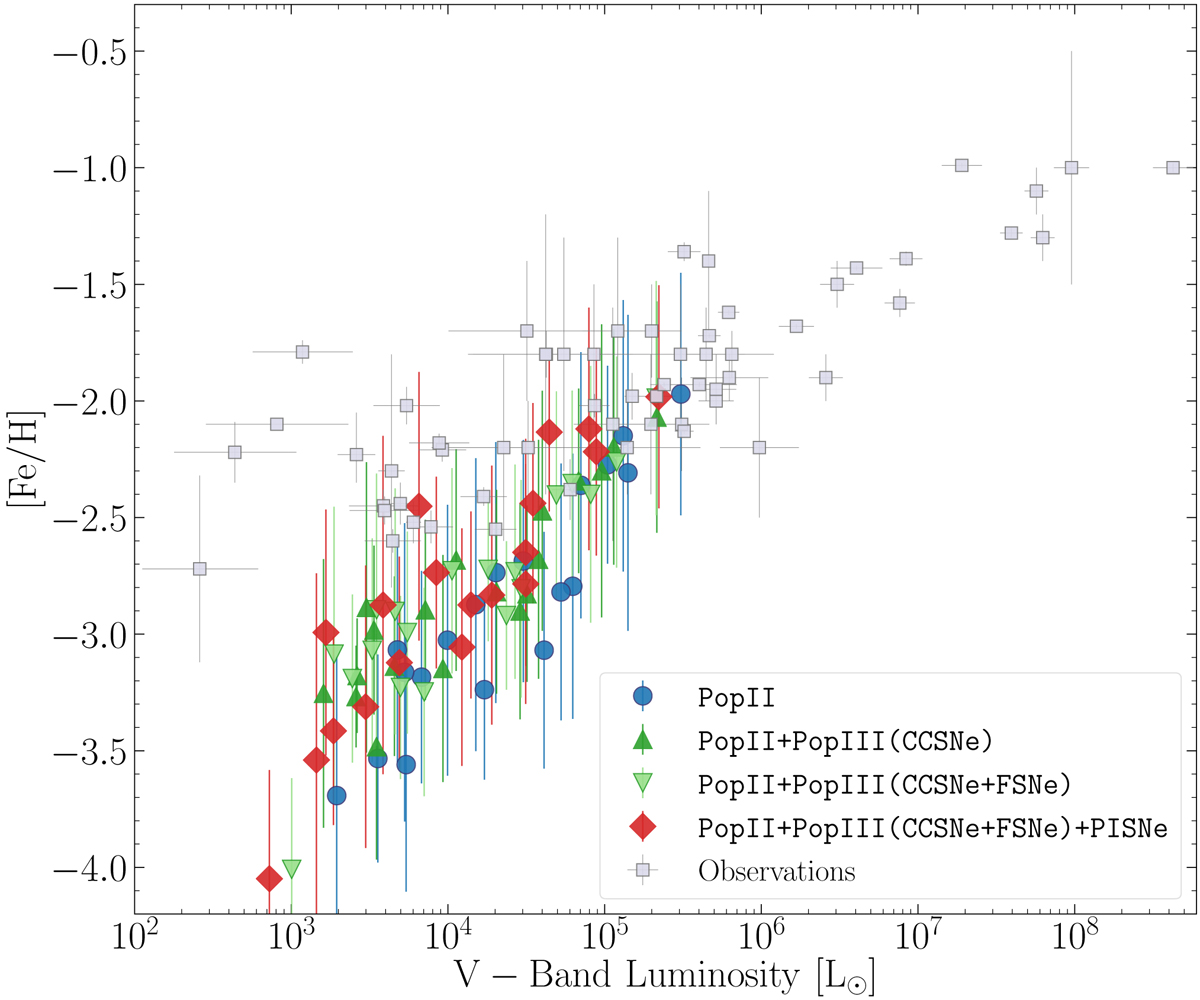
Fig. 6.
Download original image
Comparison of the luminosity-metallicity relation for dwarfs and UFDs, between Local Group observations and simulations. The gray squares represent our Local Group sample (see text for details). Colored points stand for different simulations described in Table 1: The reference PopII model is in blue points, model PopIII(CCSNe) including yields from both massive and low-mass Pop III stars is in dark green triangles, model PopIII(CCSNe+FSNe) including yields from only low-mass Pop III stars is in light green triangles, and model PISNe including yields from PISNe is in red diamonds. Error bars are computed following the method discussed in Sect. 3.6.
Current usage metrics show cumulative count of Article Views (full-text article views including HTML views, PDF and ePub downloads, according to the available data) and Abstracts Views on Vision4Press platform.
Data correspond to usage on the plateform after 2015. The current usage metrics is available 48-96 hours after online publication and is updated daily on week days.
Initial download of the metrics may take a while.