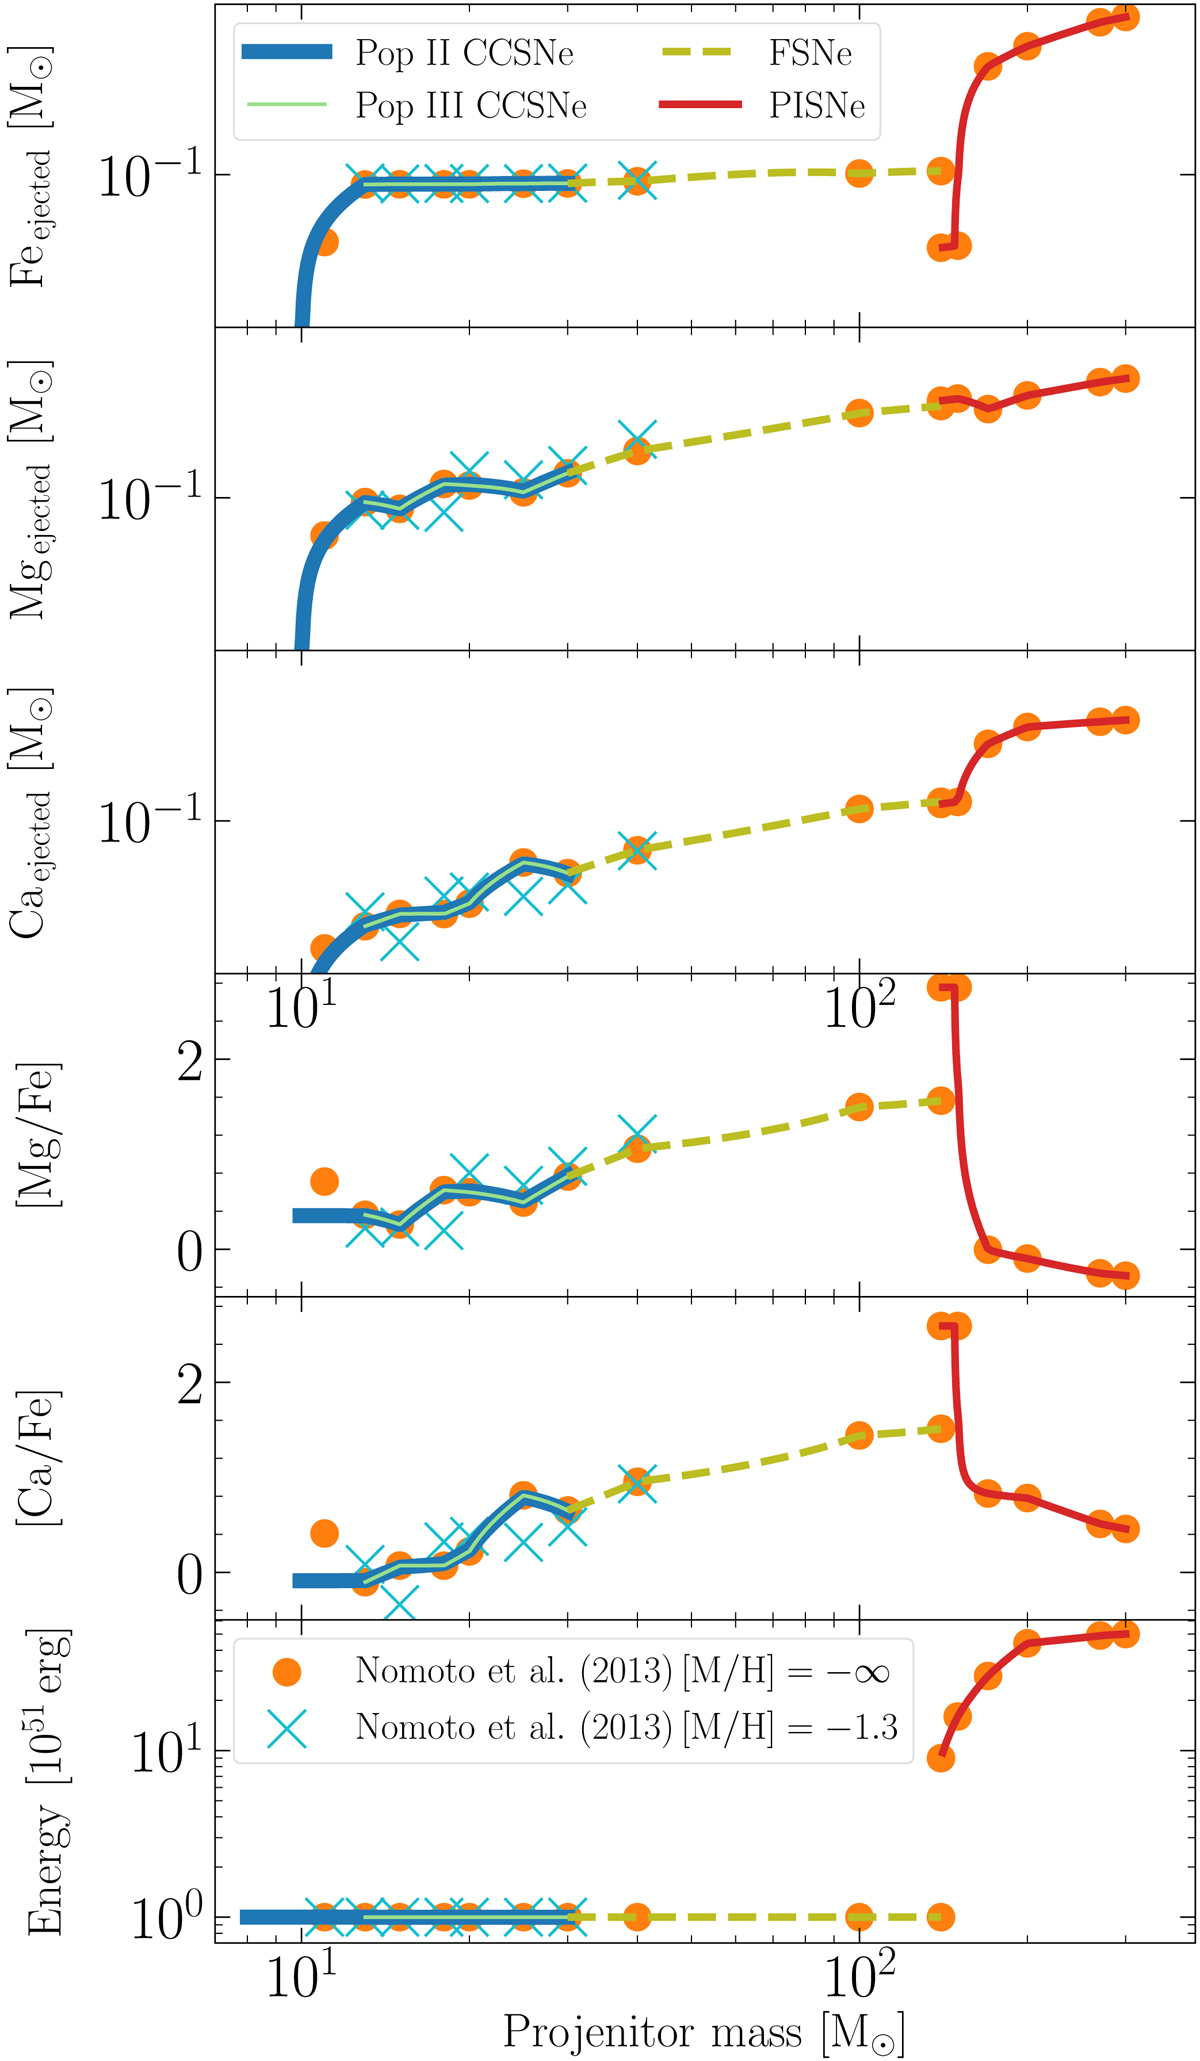
Fig. 2.
Download original image
Comparison of the yields of iron, magnesium, and calcium as a function of stellar masses from N13. The corresponding abundance ratios [Mg/Fe] and [Ca/Fe], and the supernovae explosion energies are also shown. The N13 table values for stars with Mproj < 30 M⊙ at [FM/H] = − ∞ and −1.3 are shown with orange circles and blue crosses, respectively. The thick blue and thin green curves respectively show the adopted, interpolated values used in this work for the Pop II and Pop III stars. The dashed yellow lines indicate the mass ranges of stars ending as FSNe. The red curves show the yields and energies for PISNe with Mproj > 140 M⊙ examined in this work from N13.
Current usage metrics show cumulative count of Article Views (full-text article views including HTML views, PDF and ePub downloads, according to the available data) and Abstracts Views on Vision4Press platform.
Data correspond to usage on the plateform after 2015. The current usage metrics is available 48-96 hours after online publication and is updated daily on week days.
Initial download of the metrics may take a while.