Fig. 13.
Download original image
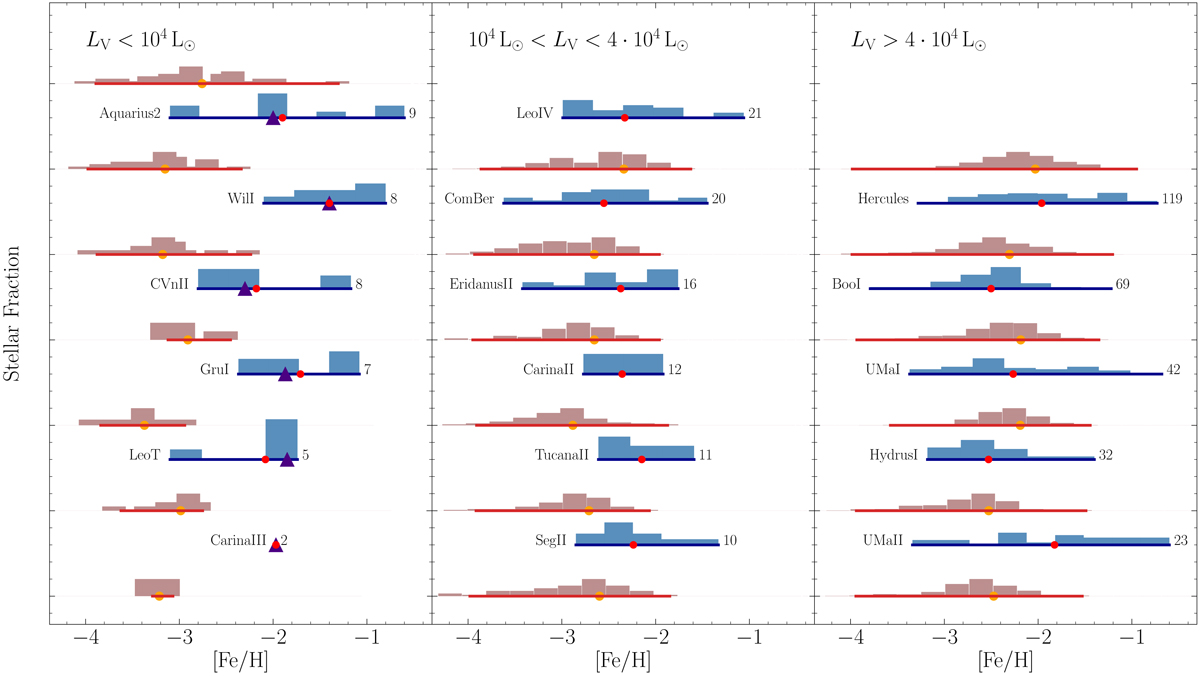
Comparison of the metallicity distribution functions of the PISNe(Z-4) model (in red) and a set of observed galaxies (in blue) in three luminosity ranges. The solid red and blue horizontal lines indicate the full extent of the stellar metallicity distributions in the simulations and observations, respectively. The orange points show the mode of the [Fe/H] model distribution (see Appendix A). The purple triangles and red points represent, respectively, the median and mean of metallicities for each observed galaxy. The number of the spectroscopically confirmed member stars with metallicity estimates is indicated.
Current usage metrics show cumulative count of Article Views (full-text article views including HTML views, PDF and ePub downloads, according to the available data) and Abstracts Views on Vision4Press platform.
Data correspond to usage on the plateform after 2015. The current usage metrics is available 48-96 hours after online publication and is updated daily on week days.
Initial download of the metrics may take a while.