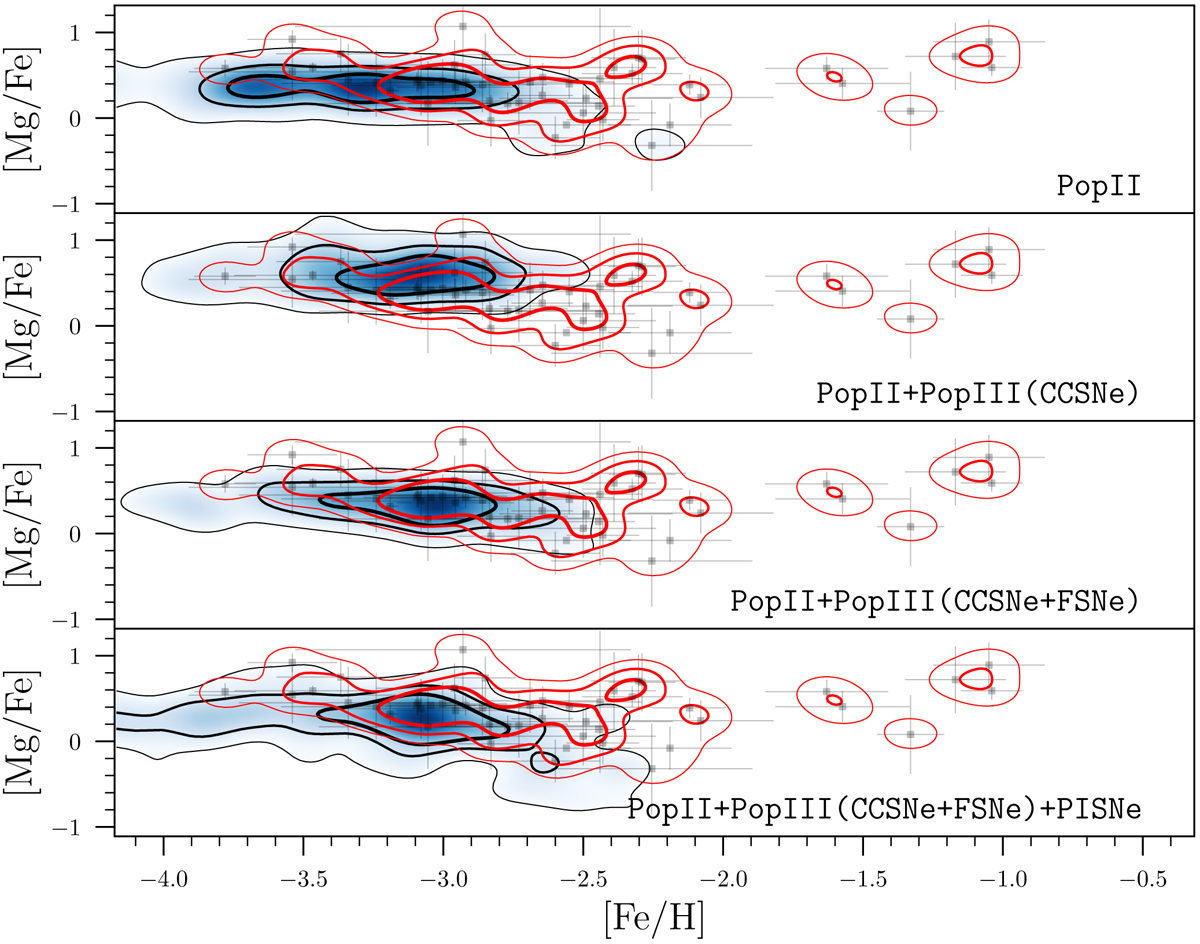
Fig. 10.

Download original image
[Mg/Fe] vs. [Fe/H] for the UFDs with luminosities lower than 104 L⊙, for the models (in blue) and the observations (in gray). Contours, in black for the models and in red for the observations, represent the regions encompassing 30, 60, and 90% of the stars. The data contain a total of 49 stars from Bootes II (Ji et al. 2016d; Koch et al. 2009; François et al. 2016), Canes Venatici II (François et al. 2016; Vargas et al. 2013), Grus I (Ji et al. 2019), Horologium (Nagasawa et al. 2018), Leo IV (Simon et al. 2010; François et al. 2016), Reticulum II (Ji et al. 2016c,a; Roederer et al. 2016; Ji & Frebel 2018), Segue I (Norris et al. 2010a; Vargas et al. 2013; Frebel et al. 2014), Segue II (Kirby et al. 2013), Triangulum II (Venn et al. 2017; Kirby et al. 2017; Ji et al. 2019), Tucana II (Ji et al. 2016b; Chiti et al. 2018), Tucana III (Hansen et al. 2017), and Ursa Major II (Frebel et al. 2010; Vargas et al. 2013).
Current usage metrics show cumulative count of Article Views (full-text article views including HTML views, PDF and ePub downloads, according to the available data) and Abstracts Views on Vision4Press platform.
Data correspond to usage on the plateform after 2015. The current usage metrics is available 48-96 hours after online publication and is updated daily on week days.
Initial download of the metrics may take a while.


