Fig. 6
Download original image
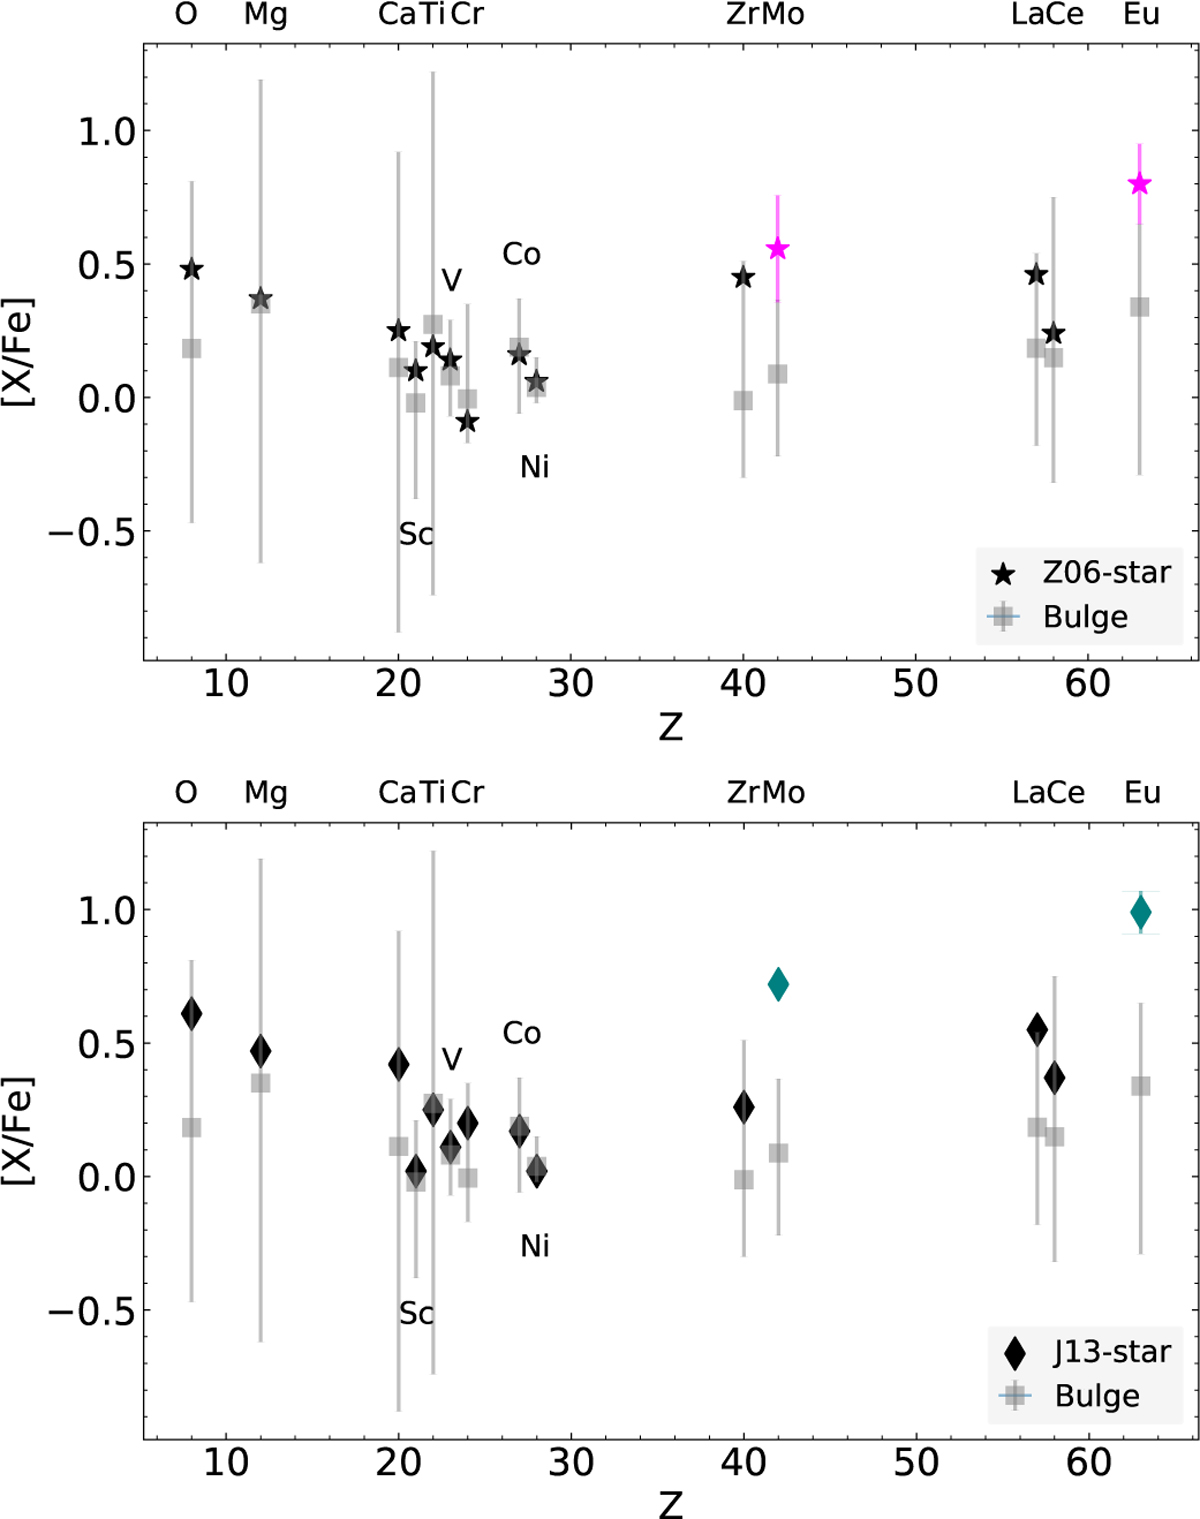
[X/Fe] over Z for the bulge abundances (grey) presented in the Jönsson-series (Jönsson et al. 2017b; Lomaeva et al. 2019; Forsberg et al. 2019, 2022) for the Z06-star (upper plot, indicated with a star-symbol and the estimated uncertainties) and Johnson et al. (2013)-star (lower plot, indicated with a diamond). The bulge abundances are indicated by the mean (grey box) with the highest and lowest value (the Z06-star excluded) indicated by the bar, showing the spread in abundance in the bulge sample. To facilitate the reading of the plot, the element corresponding to a certain Z has been indicated. The r-process elements Mo and Eu has been indicated using magenta (Z06-star) and teal (J13-star).
Current usage metrics show cumulative count of Article Views (full-text article views including HTML views, PDF and ePub downloads, according to the available data) and Abstracts Views on Vision4Press platform.
Data correspond to usage on the plateform after 2015. The current usage metrics is available 48-96 hours after online publication and is updated daily on week days.
Initial download of the metrics may take a while.