Fig. 4
Download original image
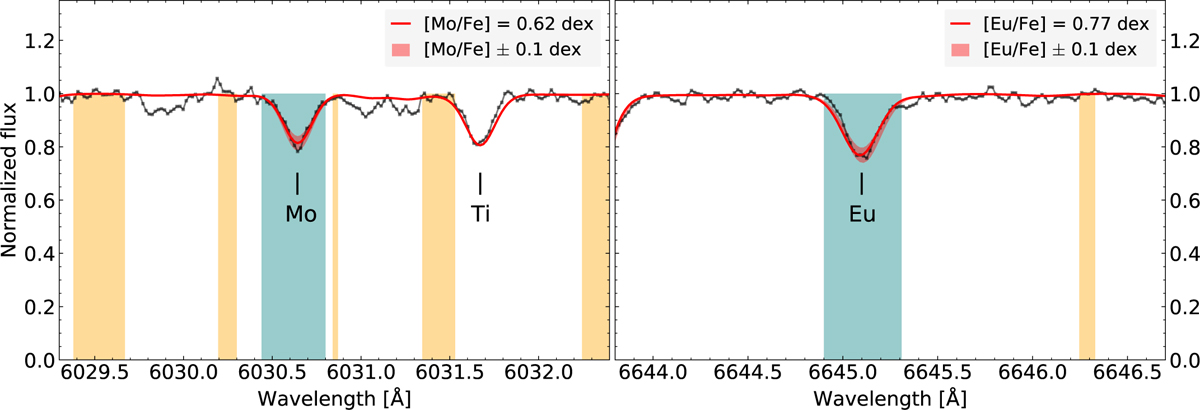
As Fig. 3, the observed spectrum of the Z06-star can be seen in black. The line mask placements for the Mo (left) and Eu (right) line can be seen in turquoise and the continuum placements in yellow. The best fit to the synthetic spectrum is shown with a solid red line and the ±0.1 dex with a shaded red. Note that the wavelength region is zoomed in compared to Fig. 3 to better show the fit of the synthetic spectrum.
Current usage metrics show cumulative count of Article Views (full-text article views including HTML views, PDF and ePub downloads, according to the available data) and Abstracts Views on Vision4Press platform.
Data correspond to usage on the plateform after 2015. The current usage metrics is available 48-96 hours after online publication and is updated daily on week days.
Initial download of the metrics may take a while.