Fig. 2
Download original image
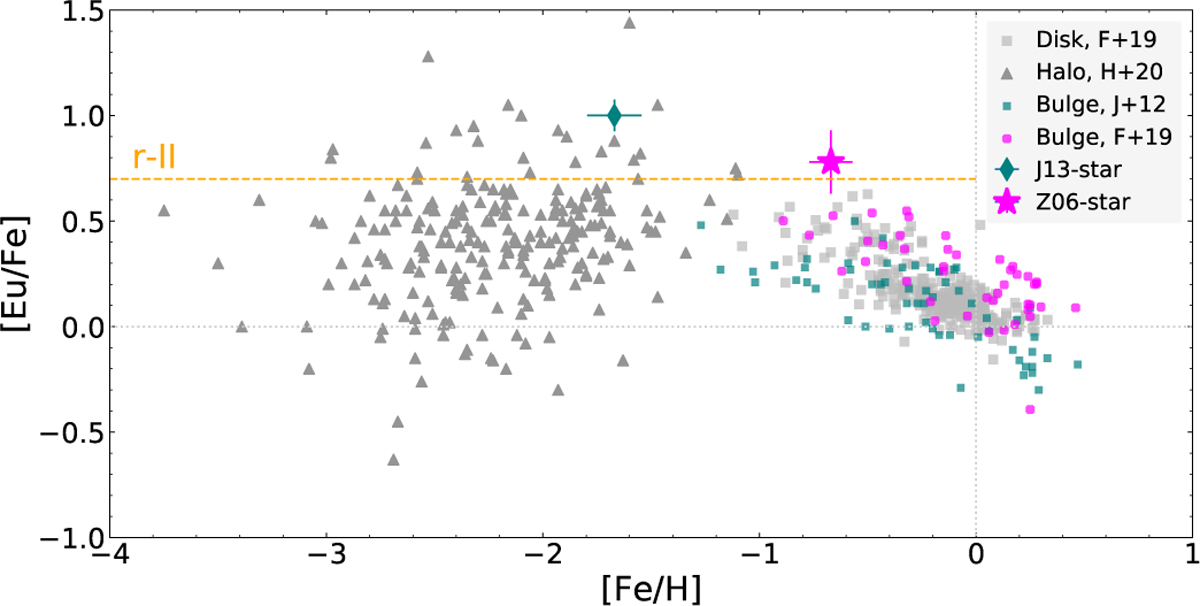
[Eu/Fe] over [Fe/H] for the Z06-star (magenta star) and the J13-star (teal diamond). For reference, we plot the bulge (magenta circles) and disc stars (grey squares) from Forsberg et al. (2019) as well as the bulge stars from Johnson et al. (2012). The abundances of the halo stars come from the r-process alliance sample (dark grey triangles Holmbeck et al. 2020). The orange line indicates the ‘r-II’ limit as defined in the r-process alliance (Holmbeck et al. 2020). We note that the abundances from Forsberg et al. (2019) have been systematically lowered with 0.10 dex, as described in Sect. 3.1.
Current usage metrics show cumulative count of Article Views (full-text article views including HTML views, PDF and ePub downloads, according to the available data) and Abstracts Views on Vision4Press platform.
Data correspond to usage on the plateform after 2015. The current usage metrics is available 48-96 hours after online publication and is updated daily on week days.
Initial download of the metrics may take a while.