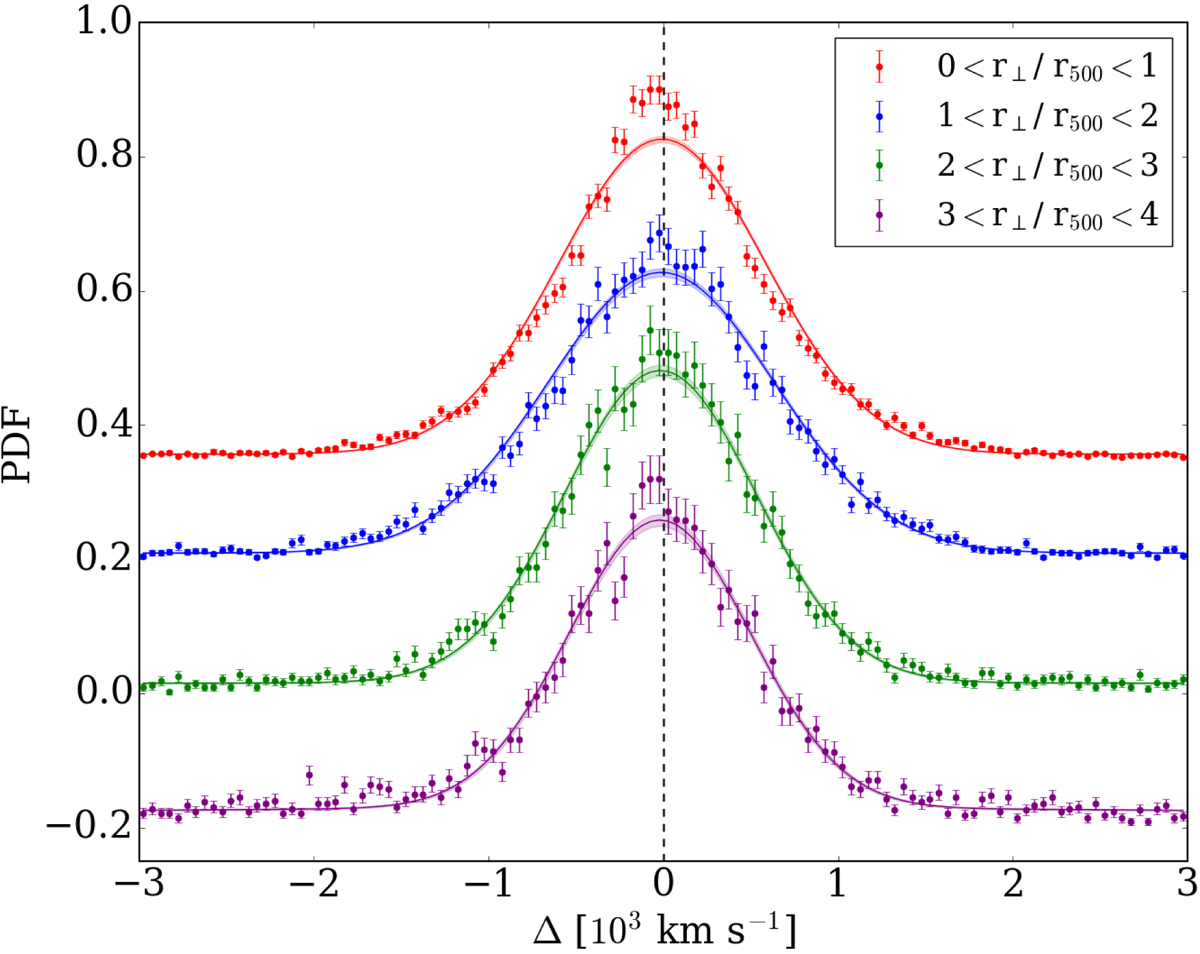
Fig. 6.
Download original image
Velocity distributions of the WH15 cluster member galaxies in the four bins of projected transverse distance. These distributions were shifted vertically by an arbitrary amount (−0.2, 0, 0.2 and 0.35), for visual purposes. The coloured points represent the data of the binned background-corrected phase-space diagram and the error bars represent the Poisson noise combined with the error of the background-correction method. The solid lines and the shaded coloured areas show the best-fit models and their errors, respectively.
Current usage metrics show cumulative count of Article Views (full-text article views including HTML views, PDF and ePub downloads, according to the available data) and Abstracts Views on Vision4Press platform.
Data correspond to usage on the plateform after 2015. The current usage metrics is available 48-96 hours after online publication and is updated daily on week days.
Initial download of the metrics may take a while.