Fig. 4.
Download original image
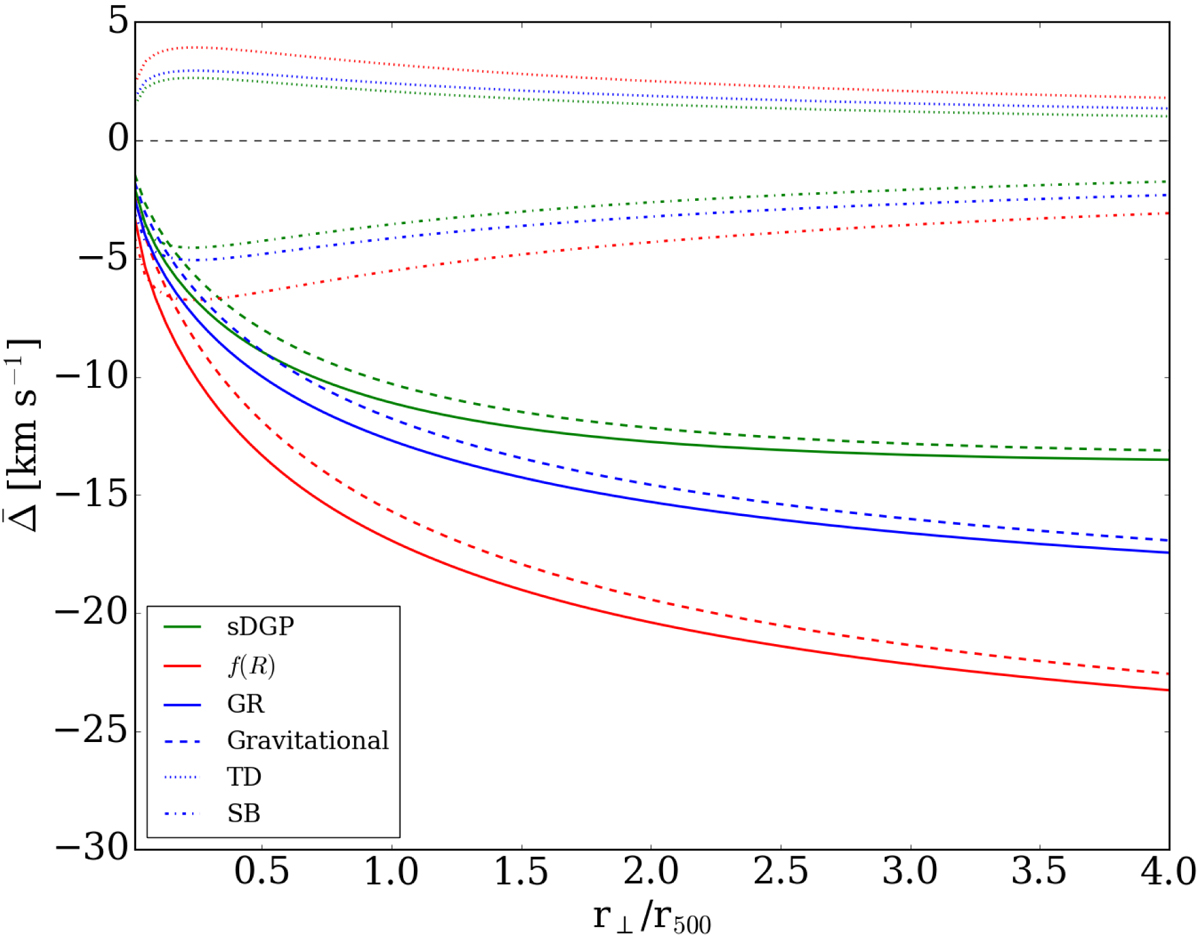
Predicted value of ![]() as a function of the cluster radius in units of r500. The blue lines refer to the predictions computed assuming GR, the green lines refer to the sDGP predictions, and the red lines refer to f(R) gravity theory. For each colour, the dashed line shows the gravitational effect only, the dotted line the TD effect, the dot-dashed line the SB effect, and the solid line shows the combined effect.
as a function of the cluster radius in units of r500. The blue lines refer to the predictions computed assuming GR, the green lines refer to the sDGP predictions, and the red lines refer to f(R) gravity theory. For each colour, the dashed line shows the gravitational effect only, the dotted line the TD effect, the dot-dashed line the SB effect, and the solid line shows the combined effect.
Current usage metrics show cumulative count of Article Views (full-text article views including HTML views, PDF and ePub downloads, according to the available data) and Abstracts Views on Vision4Press platform.
Data correspond to usage on the plateform after 2015. The current usage metrics is available 48-96 hours after online publication and is updated daily on week days.
Initial download of the metrics may take a while.