Fig. 3.
Download original image
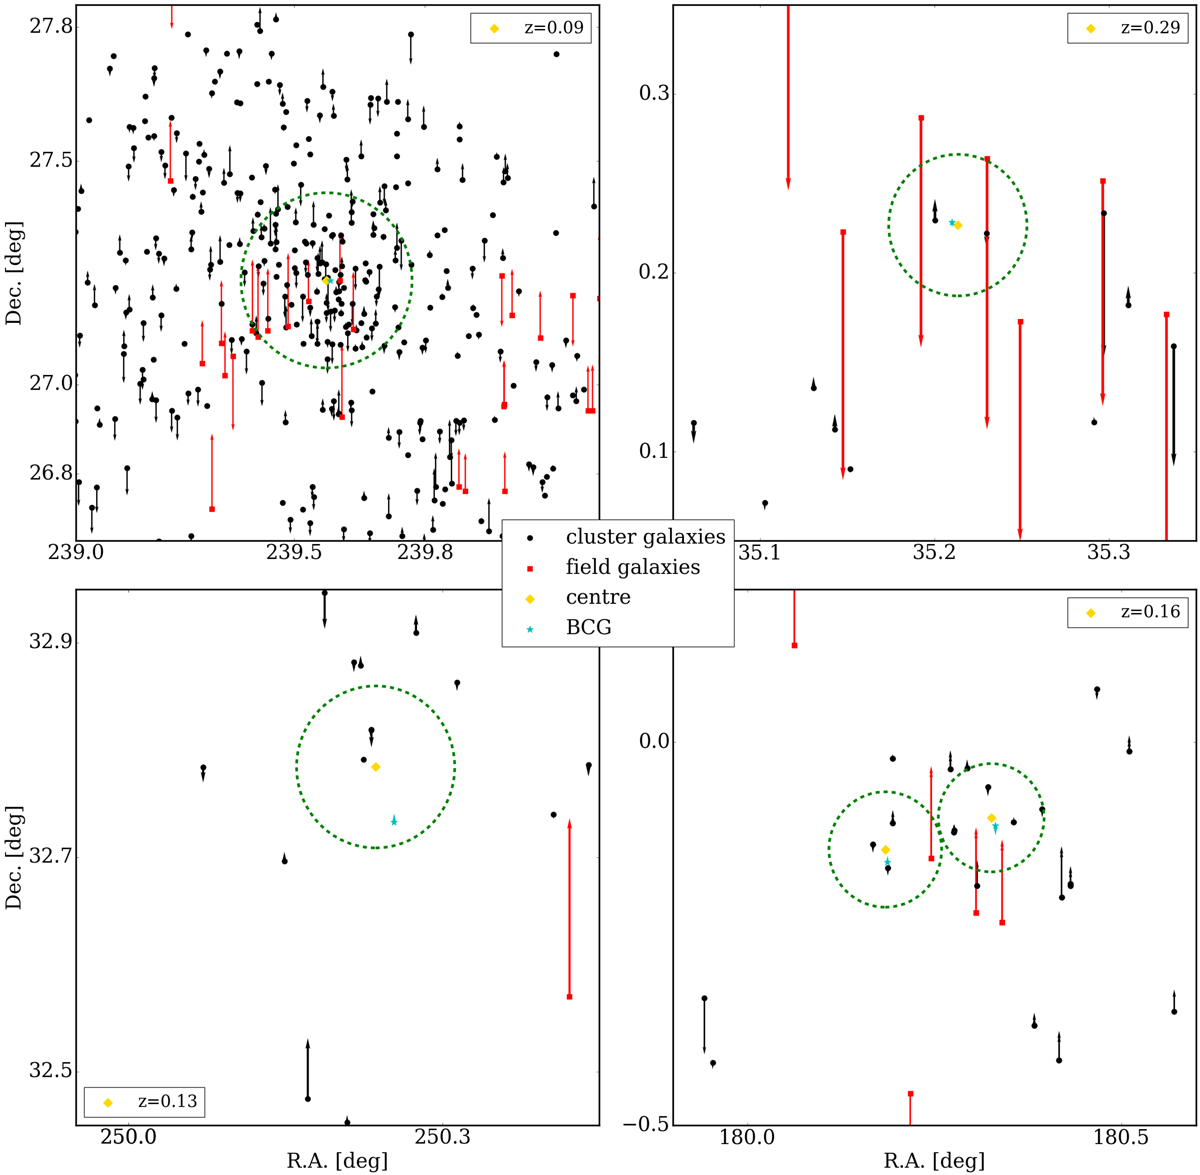
Angular maps around four galaxy clusters of the selected sample. The black points represent the cluster member galaxies, while the red squares show the positions of the field galaxies. The gold diamond shows the cluster centres and the cyan star represents the cluster BCGs. The dashed green circle indicates the cluster r500 radii. The arrows show the galaxy line-of-sight velocities with respect to the cluster centres. The arrows pointing upwards (downwards) represent positive (negative) velocities. The objects are representative examples of four different cluster types: a low-redshift massive cluster with a large number of identified galaxy members (top left panel); a high-redshift small cluster, though with a sufficient number of members (top right panel); an isolated cluster with only a few identified members (bottom left panel); and two small close clusters (bottom right panel).
Current usage metrics show cumulative count of Article Views (full-text article views including HTML views, PDF and ePub downloads, according to the available data) and Abstracts Views on Vision4Press platform.
Data correspond to usage on the plateform after 2015. The current usage metrics is available 48-96 hours after online publication and is updated daily on week days.
Initial download of the metrics may take a while.