Fig. 2.
Download original image
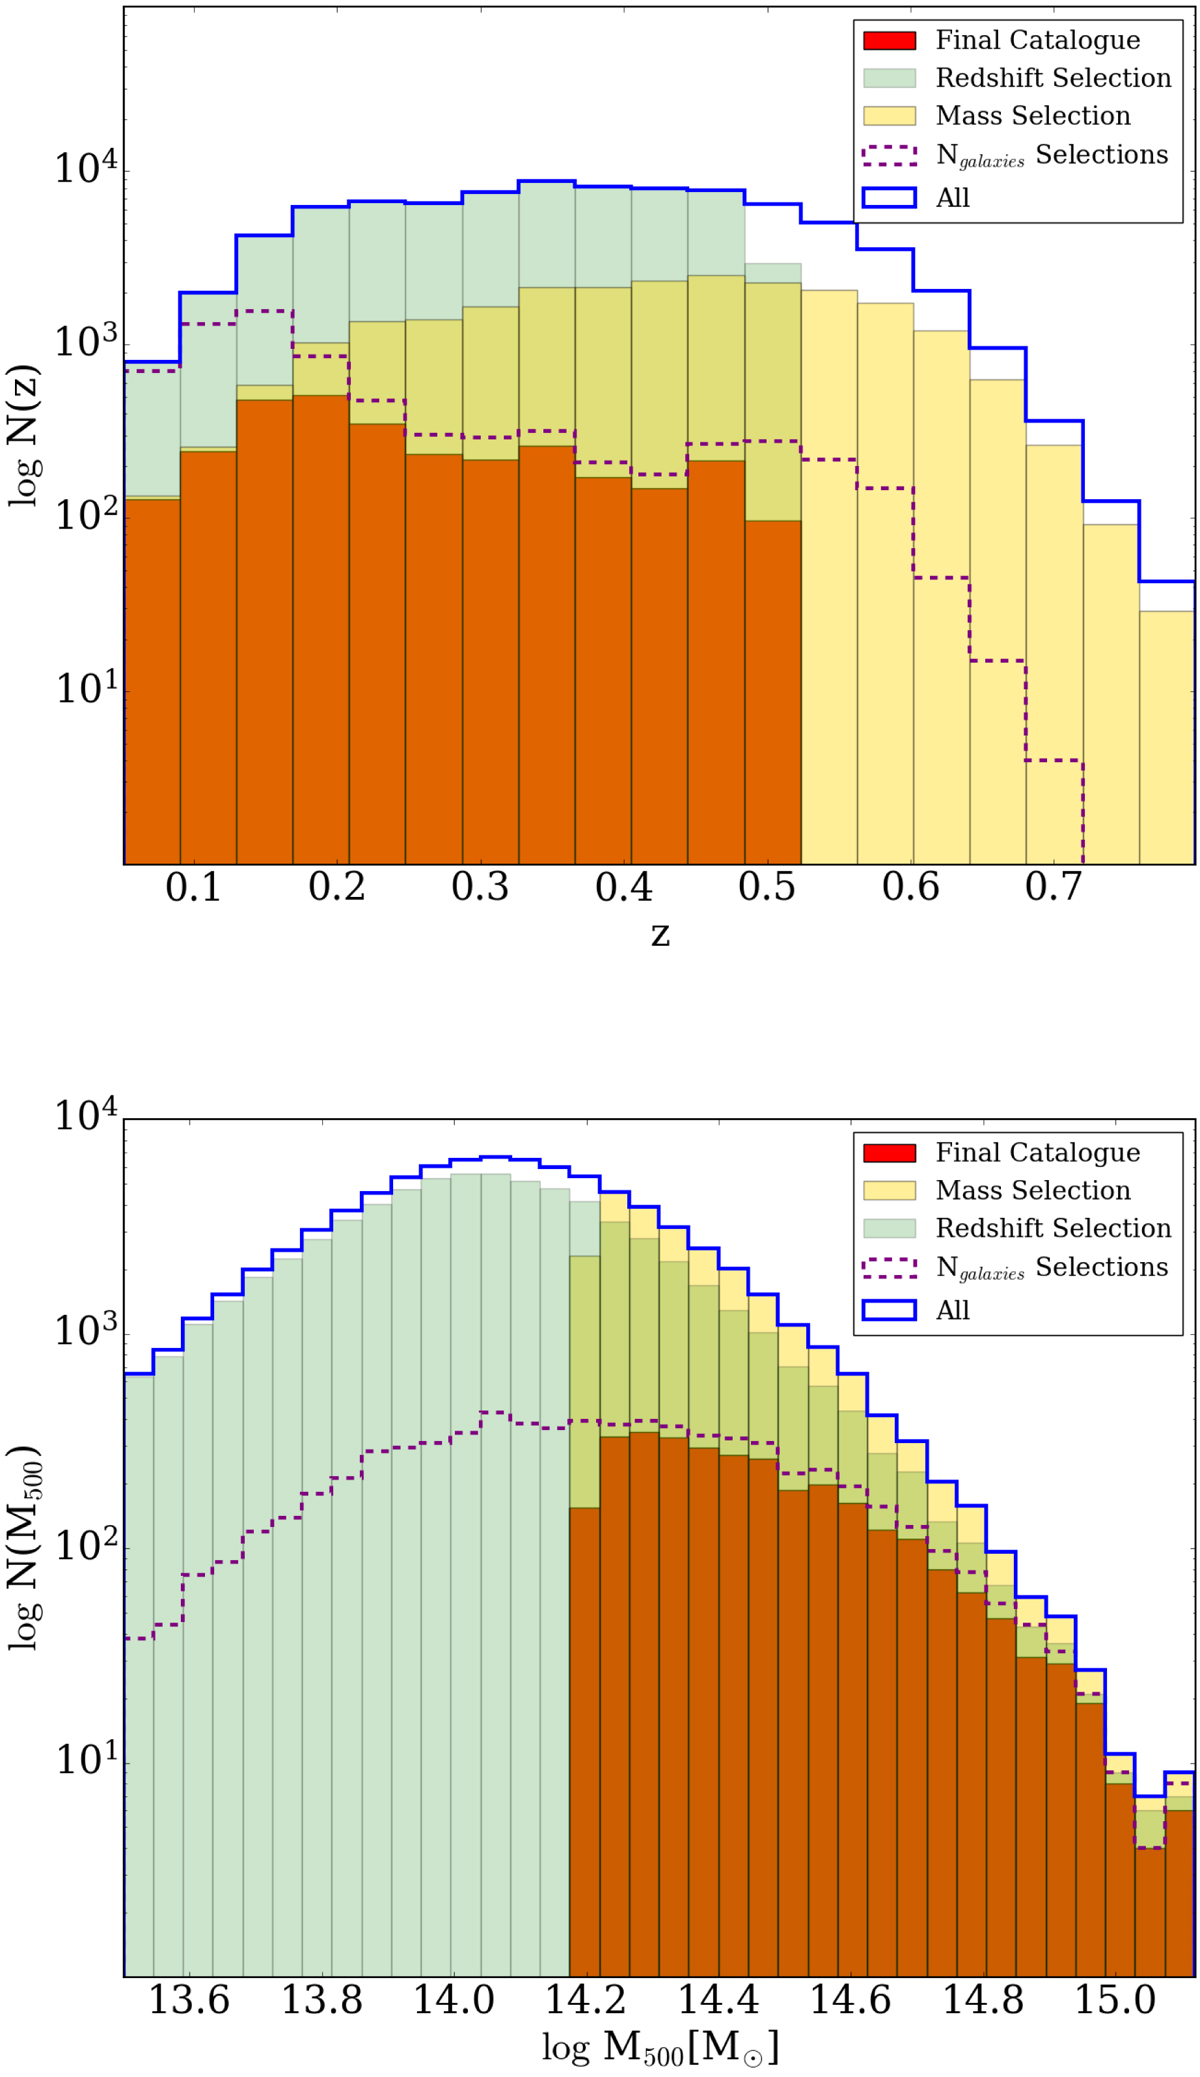
Redshift (top panel) and mass distribution (bottom panel) of the selected cluster sample. The solid blue histograms represent the distributions of all WL15 clusters within the redshift and mass ranges where the richness-mass relation was calibrated. The yellow histograms show the distributions of the clusters with mass above 1.5 × 10¹⁴ M⊙, while the green histograms show the distributions of the clusters with z < 0.5. The dashed purple histograms show the distributions of the clusters that have at least four associated galaxies. Finally, the red histograms represent the distributions of the final selected cluster sample.
Current usage metrics show cumulative count of Article Views (full-text article views including HTML views, PDF and ePub downloads, according to the available data) and Abstracts Views on Vision4Press platform.
Data correspond to usage on the plateform after 2015. The current usage metrics is available 48-96 hours after online publication and is updated daily on week days.
Initial download of the metrics may take a while.