Fig. A.4.
Download original image
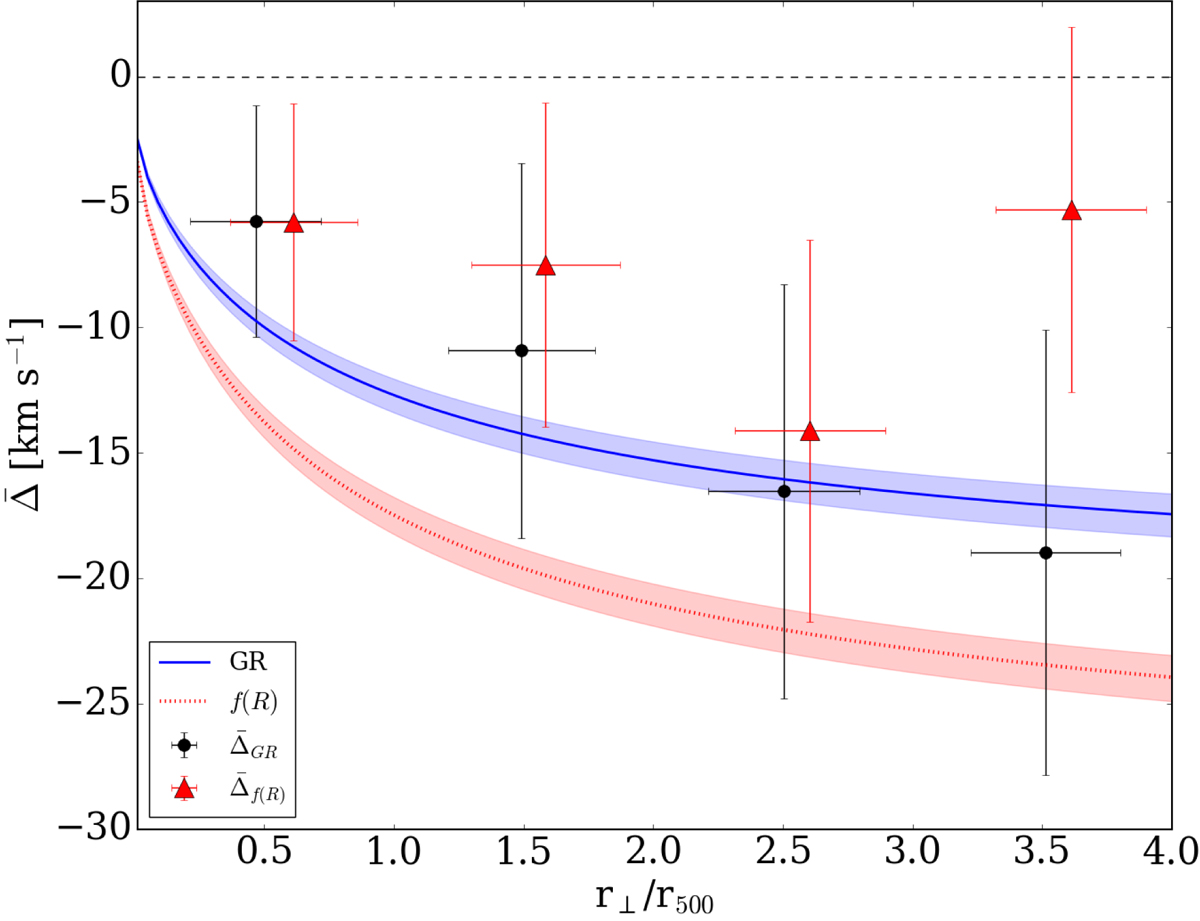
Comparison between the ![]() values computed with the scaling relation estimated in the f(R) strong field scenario,
values computed with the scaling relation estimated in the f(R) strong field scenario, ![]() (red triangles), and the ones assuming the reference scaling relation considered in this paper,
(red triangles), and the ones assuming the reference scaling relation considered in this paper, ![]() (black points). The former values are shifted horizontally by 0.1r⊥/r500, for visual purposes. The theoretical f(R) predictions were computed using the M500 values obtained from the f(R) scaling relation. The shaded coloured areas show the theoretical uncertainties caused by the fitting uncertainties on the cluster mass distribution, and the dispersion of the cluster redshifts. The vertical error bars represent the range of the
(black points). The former values are shifted horizontally by 0.1r⊥/r500, for visual purposes. The theoretical f(R) predictions were computed using the M500 values obtained from the f(R) scaling relation. The shaded coloured areas show the theoretical uncertainties caused by the fitting uncertainties on the cluster mass distribution, and the dispersion of the cluster redshifts. The vertical error bars represent the range of the ![]() parameter containing 68% of the marginalised posterior probability, while the horizontal error bars show the dispersion of the galaxy transverse distances in each given bin.
parameter containing 68% of the marginalised posterior probability, while the horizontal error bars show the dispersion of the galaxy transverse distances in each given bin.
Current usage metrics show cumulative count of Article Views (full-text article views including HTML views, PDF and ePub downloads, according to the available data) and Abstracts Views on Vision4Press platform.
Data correspond to usage on the plateform after 2015. The current usage metrics is available 48-96 hours after online publication and is updated daily on week days.
Initial download of the metrics may take a while.