Fig. A.2.
Download original image
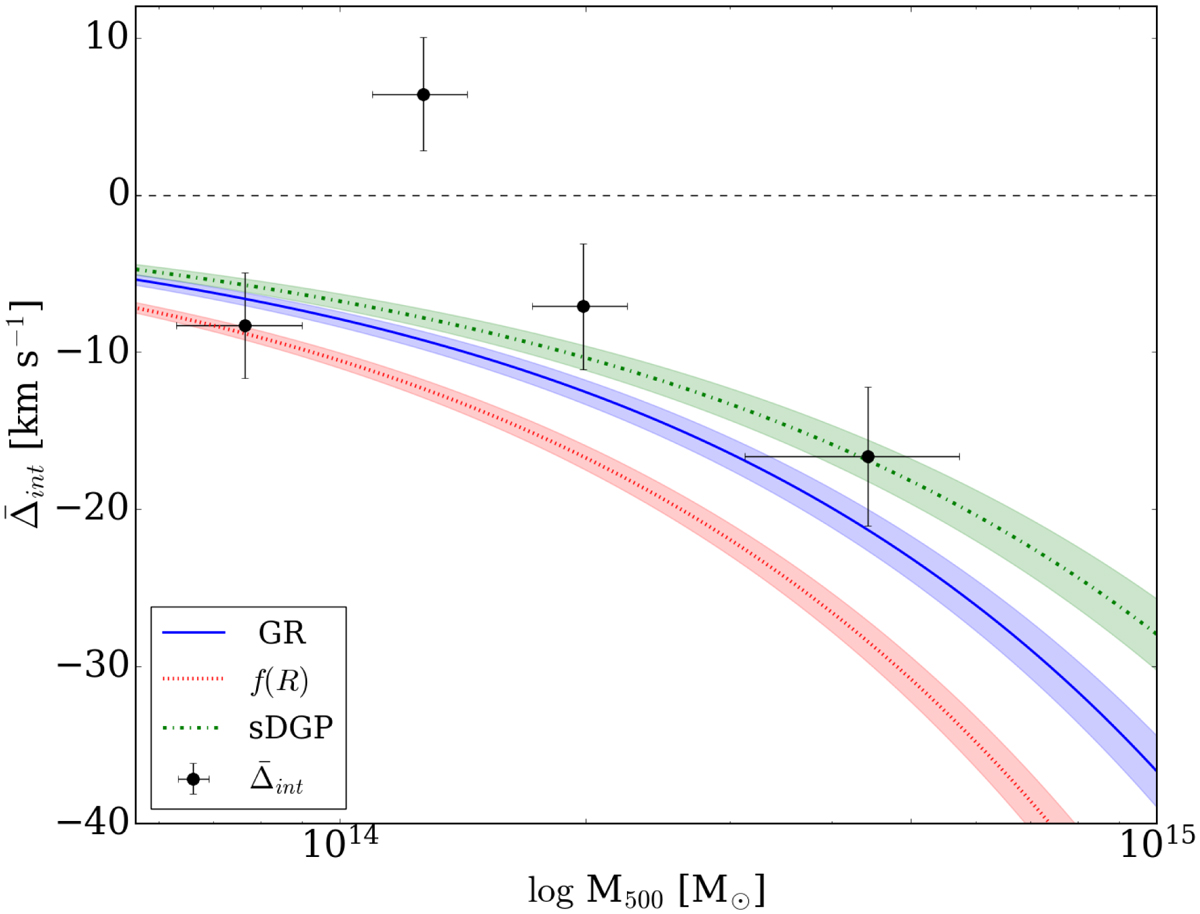
Comparison between the estimated integrated gravitational redshift signal ![]() up to 4r500 and the theoretical predictions from GR (solid blue line), f(R) (dotted red line), and sDGP (dash-dotted green line) as a function of the cluster mass. The shaded coloured areas show the model errors, while the black points show the estimated
up to 4r500 and the theoretical predictions from GR (solid blue line), f(R) (dotted red line), and sDGP (dash-dotted green line) as a function of the cluster mass. The shaded coloured areas show the model errors, while the black points show the estimated ![]() . The vertical error bars represent the range of the
. The vertical error bars represent the range of the ![]() parameter containing 68% of the marginalised posterior probability, while the horizontal error bars show the dispersion of the cluster masses in a given bin.
parameter containing 68% of the marginalised posterior probability, while the horizontal error bars show the dispersion of the cluster masses in a given bin.
Current usage metrics show cumulative count of Article Views (full-text article views including HTML views, PDF and ePub downloads, according to the available data) and Abstracts Views on Vision4Press platform.
Data correspond to usage on the plateform after 2015. The current usage metrics is available 48-96 hours after online publication and is updated daily on week days.
Initial download of the metrics may take a while.