Fig. 9.
Download original image
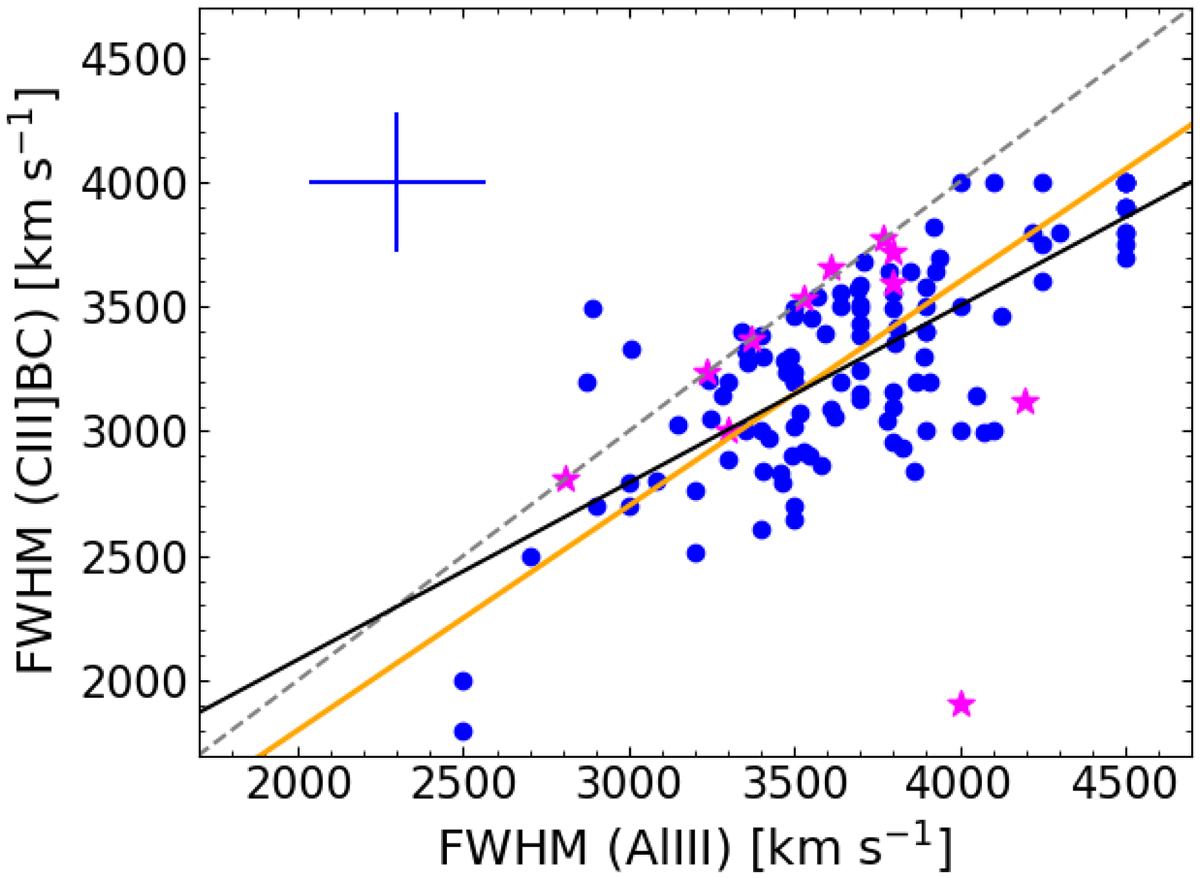
FWHM(Al IIIλ1860) vs. FWHM(C III]λ1909) for Pop. ![]() * [FWHM(C III]) ≠ FWHM(Al III)] sources. The dots are colour-coded as Figures above by population. The dashed line traces the 1:1 relation; the black line is the best fit obtained using the least-square method and the orange one is the line of FWHM(C III]) = 0.9 FWHM(Al III). The cross shows sIQRs of the uncertainties.
* [FWHM(C III]) ≠ FWHM(Al III)] sources. The dots are colour-coded as Figures above by population. The dashed line traces the 1:1 relation; the black line is the best fit obtained using the least-square method and the orange one is the line of FWHM(C III]) = 0.9 FWHM(Al III). The cross shows sIQRs of the uncertainties.
Current usage metrics show cumulative count of Article Views (full-text article views including HTML views, PDF and ePub downloads, according to the available data) and Abstracts Views on Vision4Press platform.
Data correspond to usage on the plateform after 2015. The current usage metrics is available 48-96 hours after online publication and is updated daily on week days.
Initial download of the metrics may take a while.