Fig. 8.
Download original image
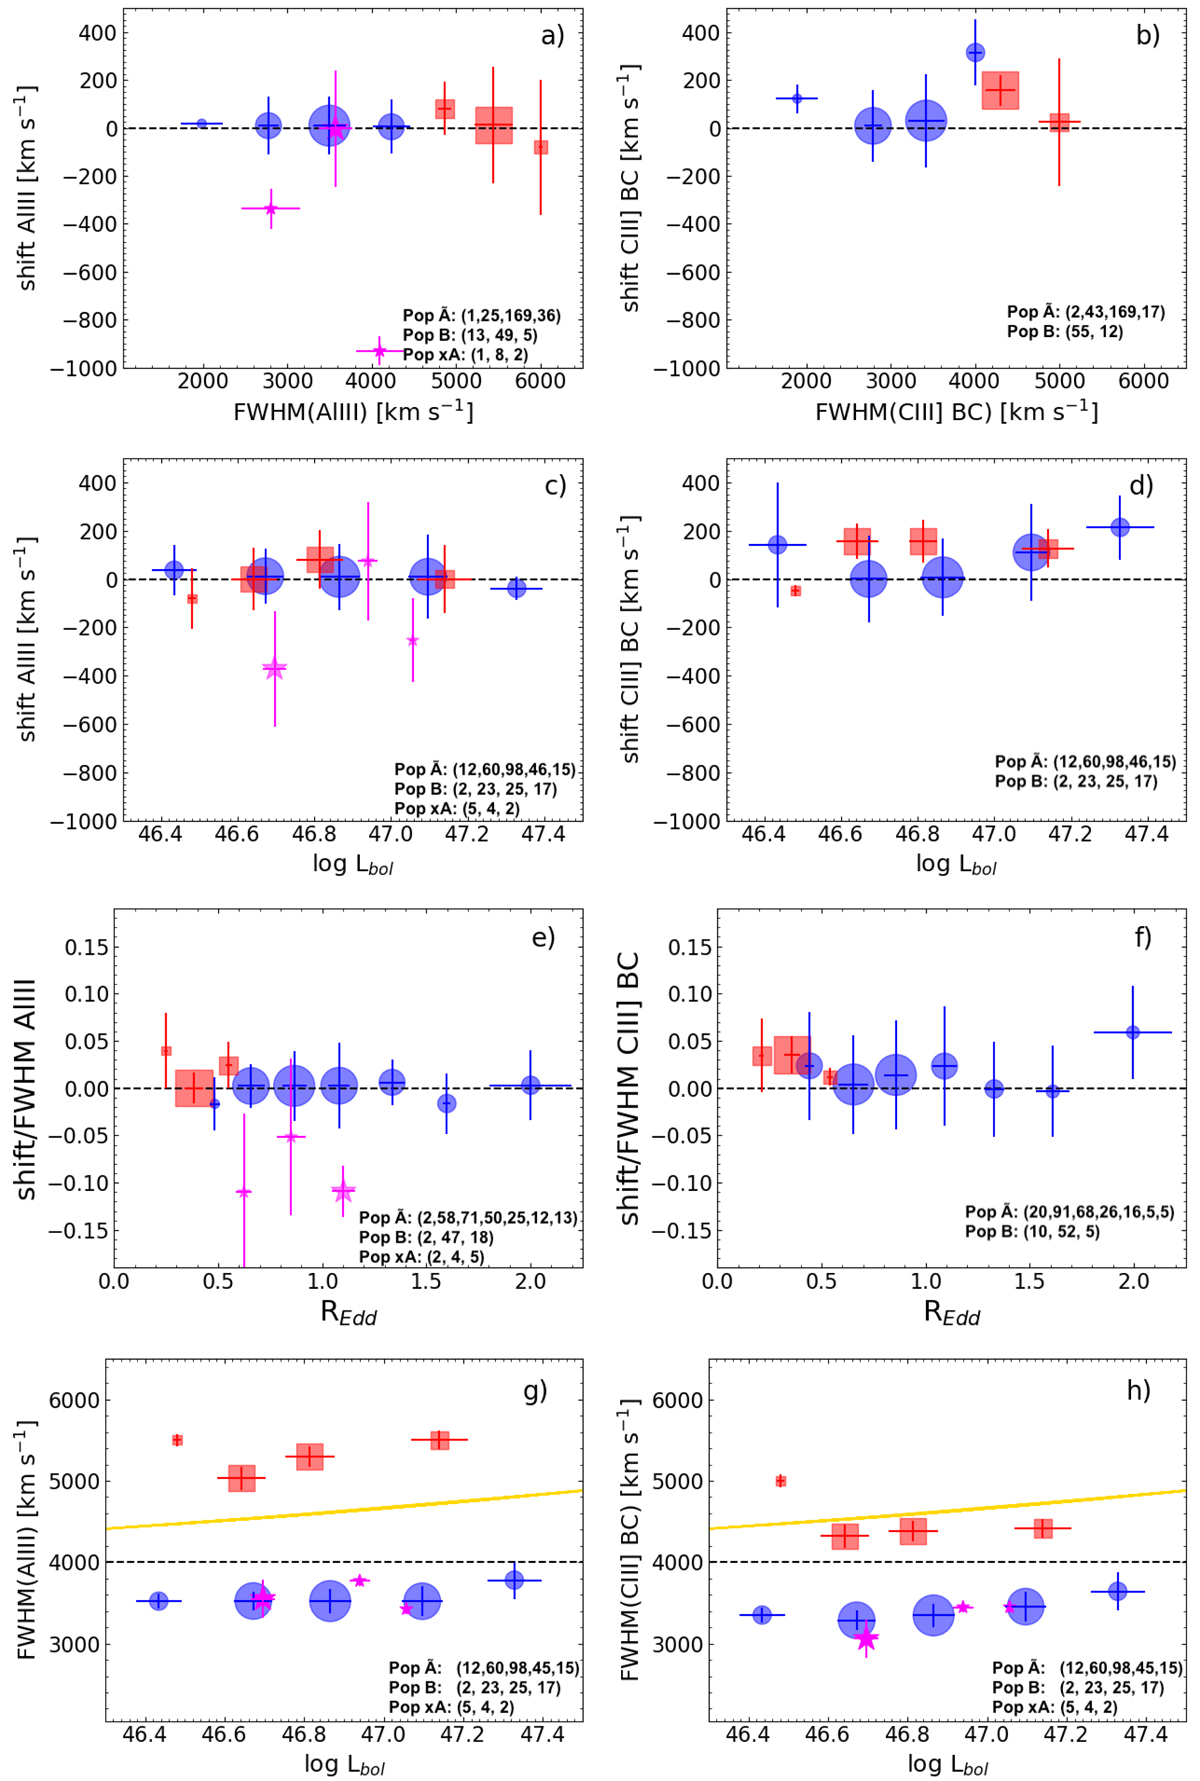
Behaviour of Al IIIλ1860 (left) and C III]λ1909 (right) by population. a),b): shift with respect to rest frame vs. FWHM. c),d): shift vs. log Lbol. e),f): ratio of shift over FWHM vs. REdd. g),h): FWHM vs. log Lbol. Lines are the luminosity-dependent limit between Pop. A and Pop. B. of Sulentic et al. (2017, gold) and the empirical separation of Sulentic et al. (2000c, dashed). Colour-coding: Pop. ![]() (blue circles), Pop. xA (magenta stars), and Pop. B (red squares). Reported values are sub-sample medians, error bars are sIQRs. Marker sizes are as indicated in the legend of each plot.
(blue circles), Pop. xA (magenta stars), and Pop. B (red squares). Reported values are sub-sample medians, error bars are sIQRs. Marker sizes are as indicated in the legend of each plot.
Current usage metrics show cumulative count of Article Views (full-text article views including HTML views, PDF and ePub downloads, according to the available data) and Abstracts Views on Vision4Press platform.
Data correspond to usage on the plateform after 2015. The current usage metrics is available 48-96 hours after online publication and is updated daily on week days.
Initial download of the metrics may take a while.