Fig. 2.
Download original image
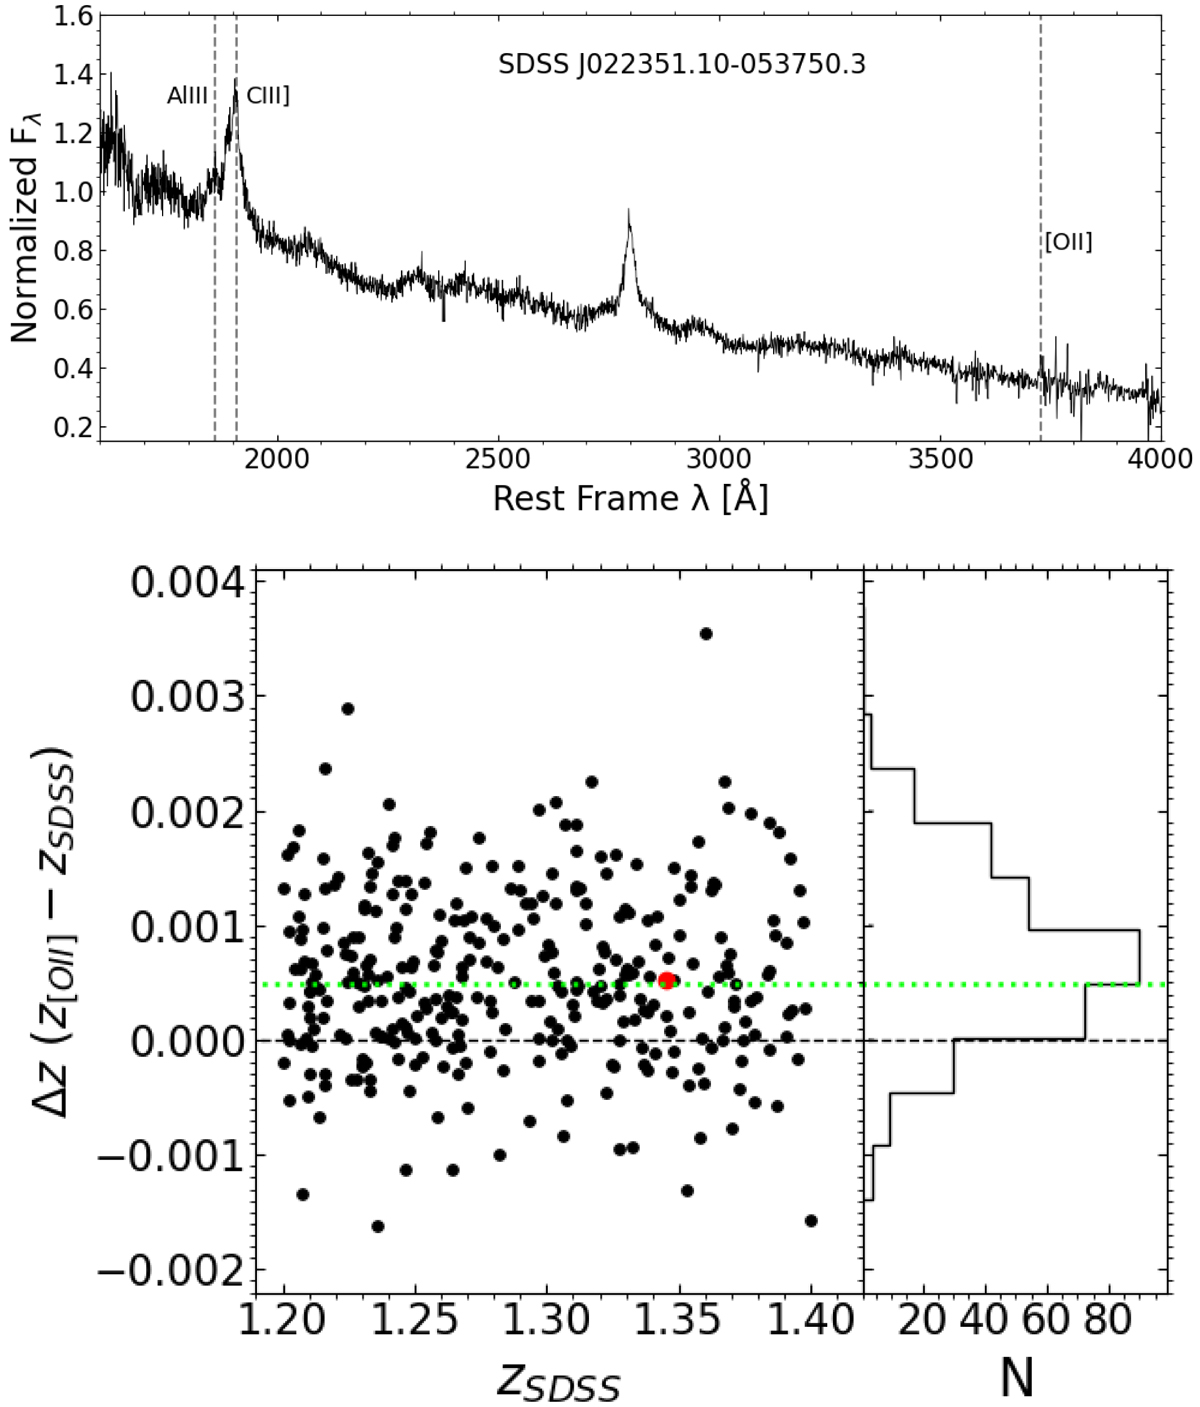
Redshift estimation and comparison with the SDSS meassurements. Upper panel: example of a spectrum from our sample. Vertical lines are the prominent emission lines of our work: Al IIIλ1860, C III]λ1909, and [O II]λ3728. The abscissa scale is rest frame wavelength in Å. The ordinate scale is the normalised flux at 1700 Å. Lower left panel: zSDSS vs. Δz for the sample. The red point corresponds to the values of Δz and z of the upper panel spectrum. Lower right panel: distribution of Δz. The lime line shows the shift Δz median value: 4.918 × 10⁻⁴ equivalent to ∼65 km s−1.
Current usage metrics show cumulative count of Article Views (full-text article views including HTML views, PDF and ePub downloads, according to the available data) and Abstracts Views on Vision4Press platform.
Data correspond to usage on the plateform after 2015. The current usage metrics is available 48-96 hours after online publication and is updated daily on week days.
Initial download of the metrics may take a while.