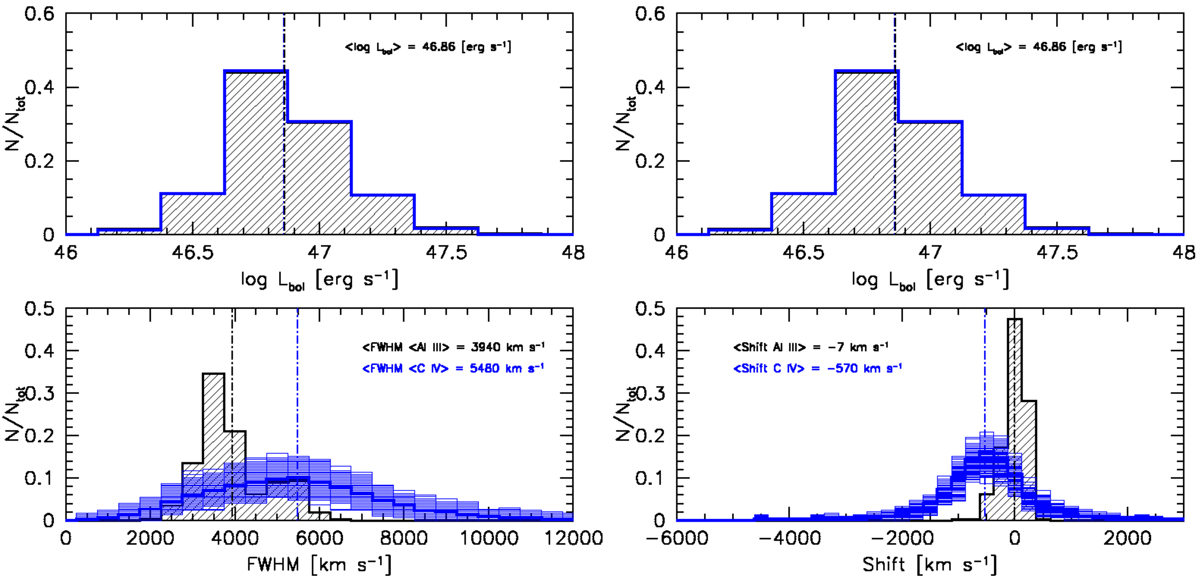
Fig. 14.
Download original image
Bootstrapped distributions for C IV luminosity, FWHM, and line peak shift. Left: inter-comparison between the Al IIIλ1860 of the present sample (hatched histograms) and the C IVλ1549 FWHM distribution of the sample of Shen et al. (2011), for matching luminosity distributions (top panel). In the bottom panel, the thin blue lines show the binned distributions of bootstrap replications of the Shen et al. (2011) data; the thick blue line is their average. Right: same as for the left panels, but for peak shift.
Current usage metrics show cumulative count of Article Views (full-text article views including HTML views, PDF and ePub downloads, according to the available data) and Abstracts Views on Vision4Press platform.
Data correspond to usage on the plateform after 2015. The current usage metrics is available 48-96 hours after online publication and is updated daily on week days.
Initial download of the metrics may take a while.