Fig. 3
Download original image
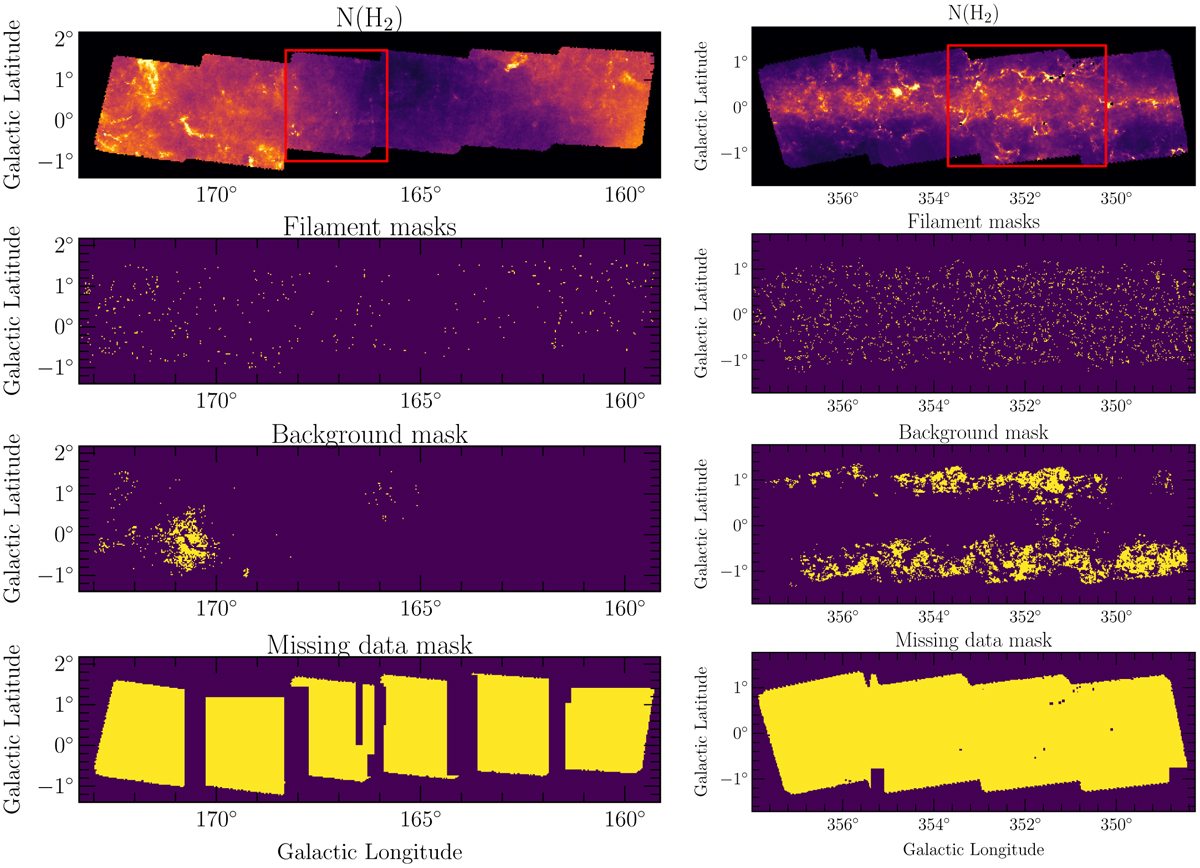
Illustration of the Galactic regions located at 160–171° (left) and 349–356° (right) of the four input maps used for the supervised learning. From top to bottom, we show the ![]() column density map, the input filament masks, a background localization map, and the missing-data map (0 in purple, 1 in yellow). All these maps were obtained as explained in Appendix A. The filament and background mask maps are multiplied by the missing-data map before they were used in the training process. The red rectangle shown in each column density map represents the region we extracted to compute the performance of the training (see Sect. 4.1).
column density map, the input filament masks, a background localization map, and the missing-data map (0 in purple, 1 in yellow). All these maps were obtained as explained in Appendix A. The filament and background mask maps are multiplied by the missing-data map before they were used in the training process. The red rectangle shown in each column density map represents the region we extracted to compute the performance of the training (see Sect. 4.1).
Current usage metrics show cumulative count of Article Views (full-text article views including HTML views, PDF and ePub downloads, according to the available data) and Abstracts Views on Vision4Press platform.
Data correspond to usage on the plateform after 2015. The current usage metrics is available 48-96 hours after online publication and is updated daily on week days.
Initial download of the metrics may take a while.