Open Access
Fig. A.1
Download original image
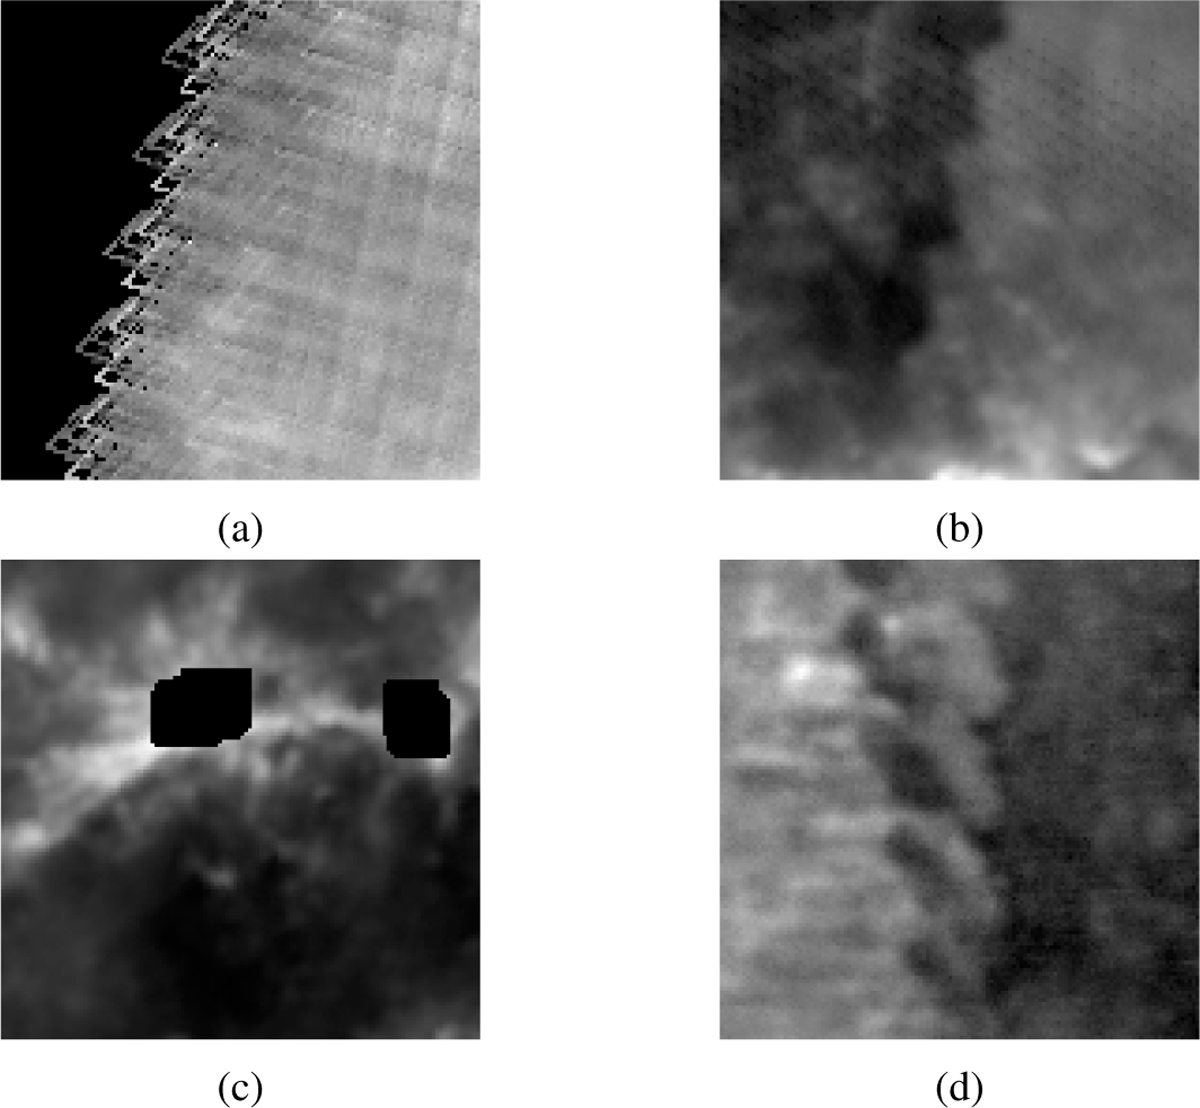
Four sources of missing data. (a) Example of a complex boundary due to satellite scanning. (b) Example of a noisy pattern inside the column density map (in log scale) due to the satellite scan. (c) Saturated pixels. (d) Example of structured artifacts built by the mapping process.
Current usage metrics show cumulative count of Article Views (full-text article views including HTML views, PDF and ePub downloads, according to the available data) and Abstracts Views on Vision4Press platform.
Data correspond to usage on the plateform after 2015. The current usage metrics is available 48-96 hours after online publication and is updated daily on week days.
Initial download of the metrics may take a while.