Fig. 22
Download original image
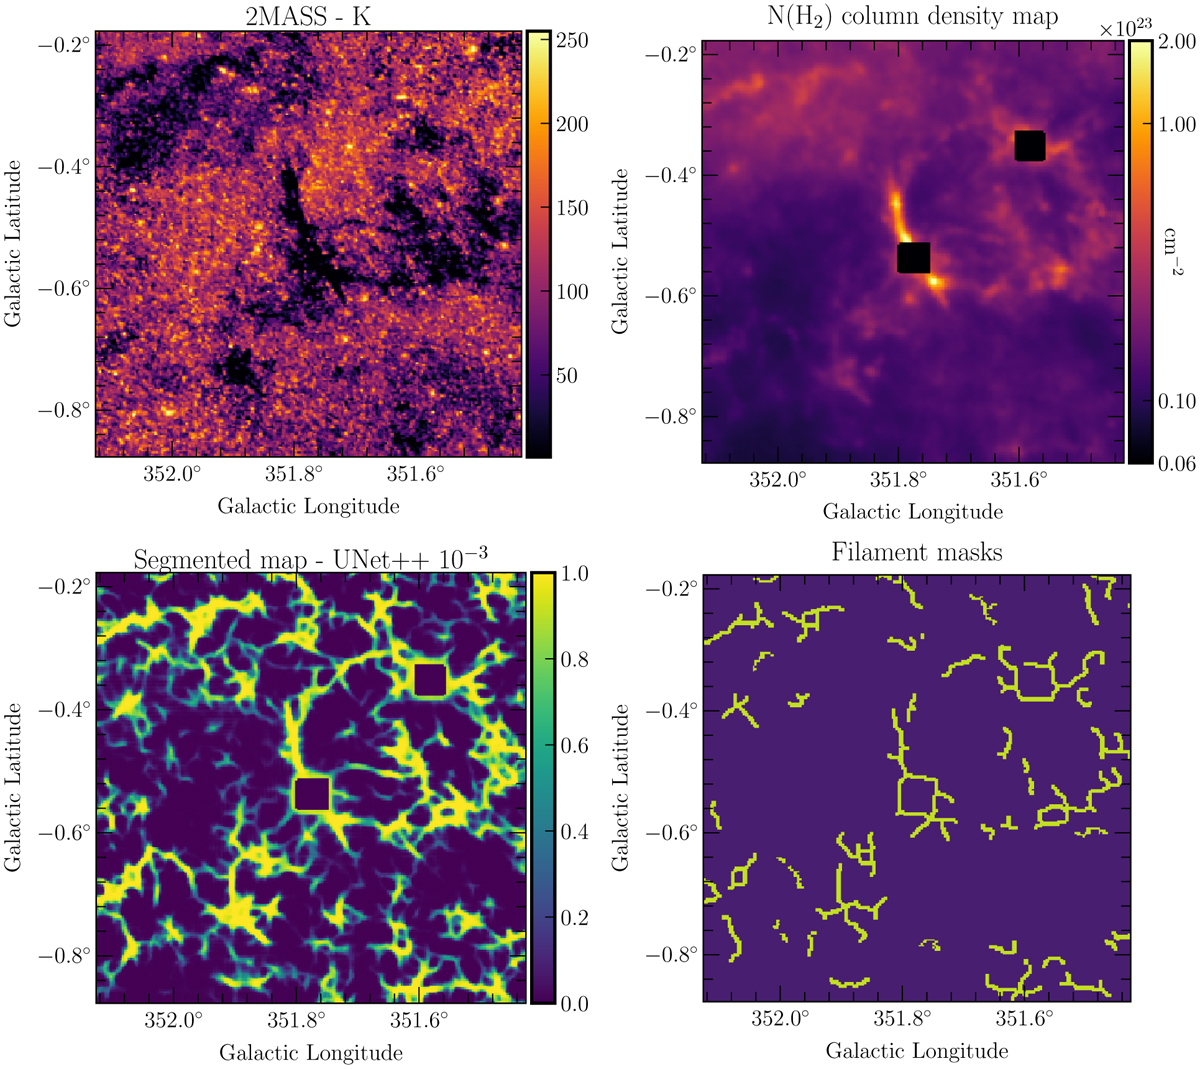
Segmented map obtained for star-forming region G351.776–0.527 (bottom left) compared with the 2MASS K-band image (top left), where filaments are observed in absorption, and the column density map (top right), where filaments are observed in emission. The filamentary structures visible in the image segmented by UNet++[10–3] (bottom left) and displayed in the [0,1] range are both visible in the 2MASS K and ![]() column density images, ensuring their nature. The G351.776–0.527 source is located at the center of the images, connected to a filamentary network (hub). The corresponding input filament mask is shown (bottom right).
column density images, ensuring their nature. The G351.776–0.527 source is located at the center of the images, connected to a filamentary network (hub). The corresponding input filament mask is shown (bottom right).
Current usage metrics show cumulative count of Article Views (full-text article views including HTML views, PDF and ePub downloads, according to the available data) and Abstracts Views on Vision4Press platform.
Data correspond to usage on the plateform after 2015. The current usage metrics is available 48-96 hours after online publication and is updated daily on week days.
Initial download of the metrics may take a while.