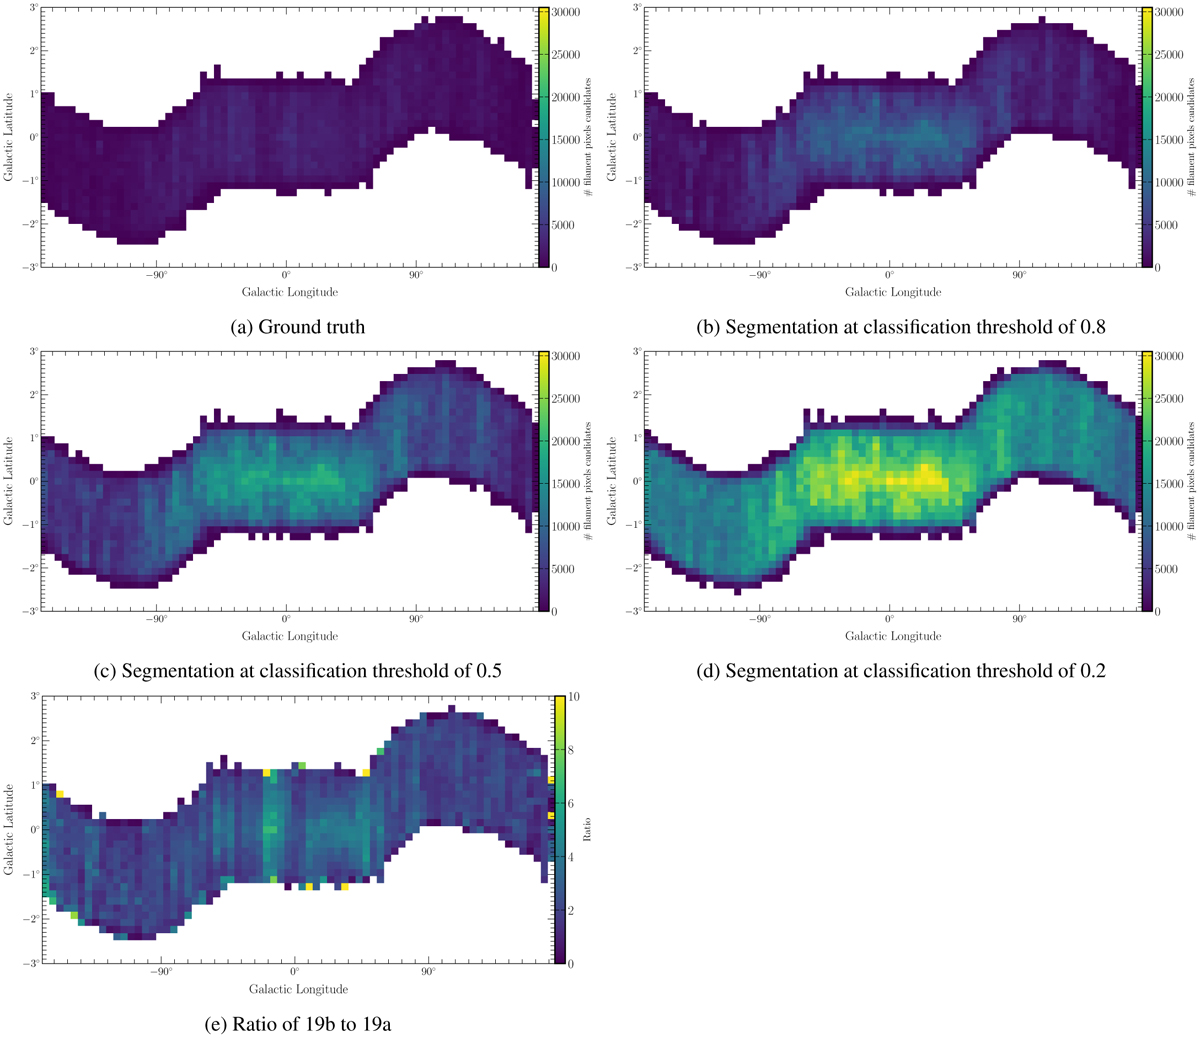
Fig. 19
Download original image
Number density distribution of candidate filament pixels across the entire Galactic plane, estimated in bins of 4.8° x 0.16° and comparing the ground truth of Fig. 19a with the segmentation results of the model UNet++ 10–3 at classification thresholds of 0.8 in Fig. 19b, 0.5 in Fig. 19c, and 0.2 in Fig. 19d. In Fig. 19e, we display the ratio of candidate filament pixels in the segmentation at a classification threshold of 0.8 to the ground truth.
Current usage metrics show cumulative count of Article Views (full-text article views including HTML views, PDF and ePub downloads, according to the available data) and Abstracts Views on Vision4Press platform.
Data correspond to usage on the plateform after 2015. The current usage metrics is available 48-96 hours after online publication and is updated daily on week days.
Initial download of the metrics may take a while.