Fig. 16
Download original image
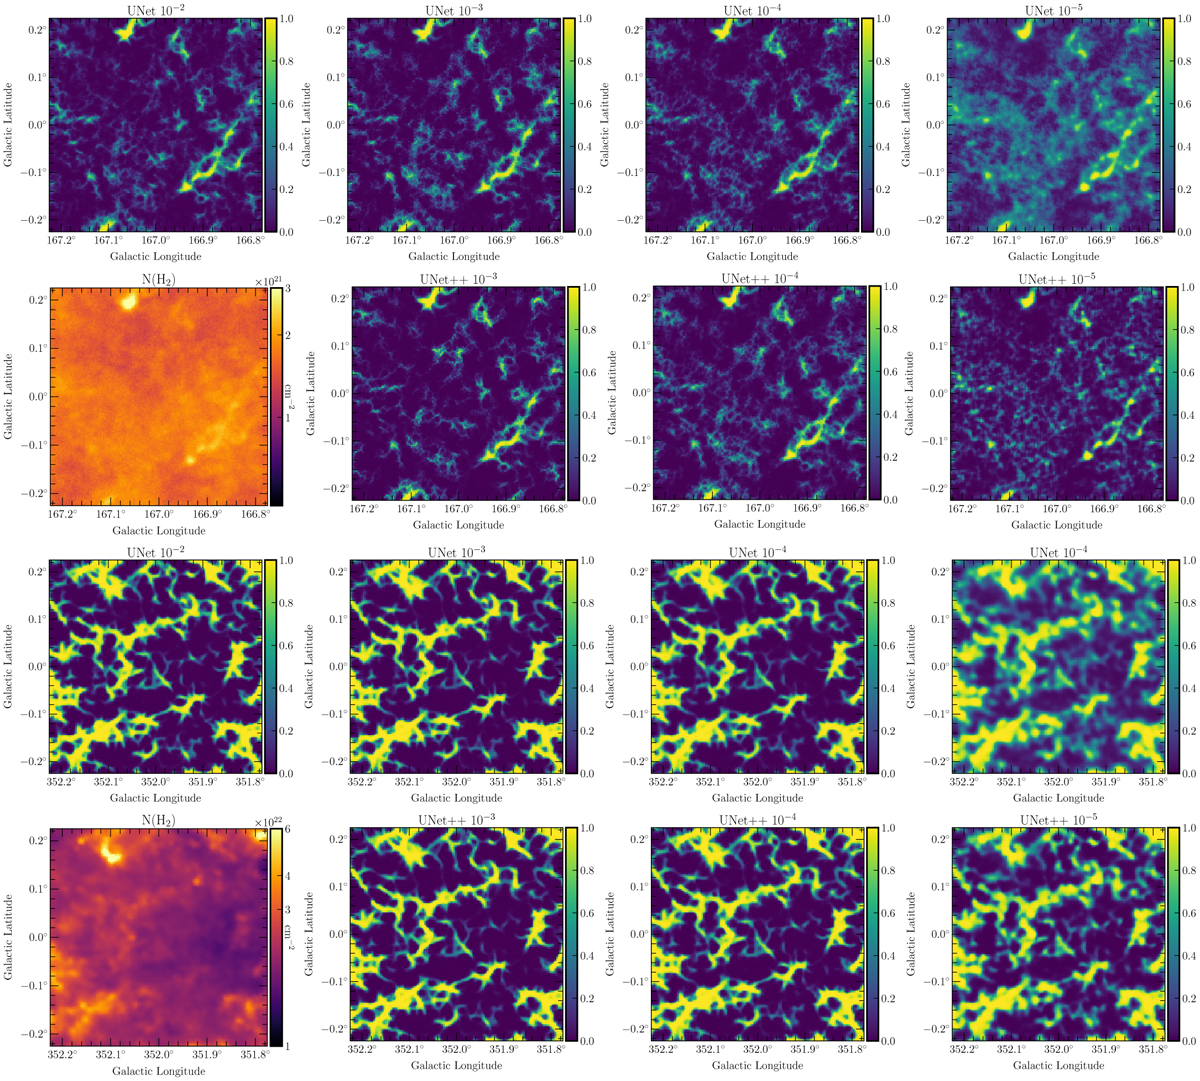
Segmented maps obtained for the models analyzed in Fig. 14, zooming in on a part of the two regions that was removed from the training namely, the l = 166.1–168.3° (top) and l = 350.3–353.5° (bottom; see the red zones identified in Fig. 3). The segmented images are displayed in the range [0,1] representing the classification value according to which a pixel belongs to the filament class. For each region, the first row shows results of the UNet segmentation, and the second row shows results of the UNet++ segmentation with initial learning-rate values of 103 (left), 10−4 to 10−5 (right). The UNet++ with a learning rate of 10−2 is not presented because of diverging results (see Sect. 4.1). The ![]() is shown at this position for each region. The regions are 0.45° × 0.45 ° wide.
is shown at this position for each region. The regions are 0.45° × 0.45 ° wide.
Current usage metrics show cumulative count of Article Views (full-text article views including HTML views, PDF and ePub downloads, according to the available data) and Abstracts Views on Vision4Press platform.
Data correspond to usage on the plateform after 2015. The current usage metrics is available 48-96 hours after online publication and is updated daily on week days.
Initial download of the metrics may take a while.