Fig. 13
Download original image
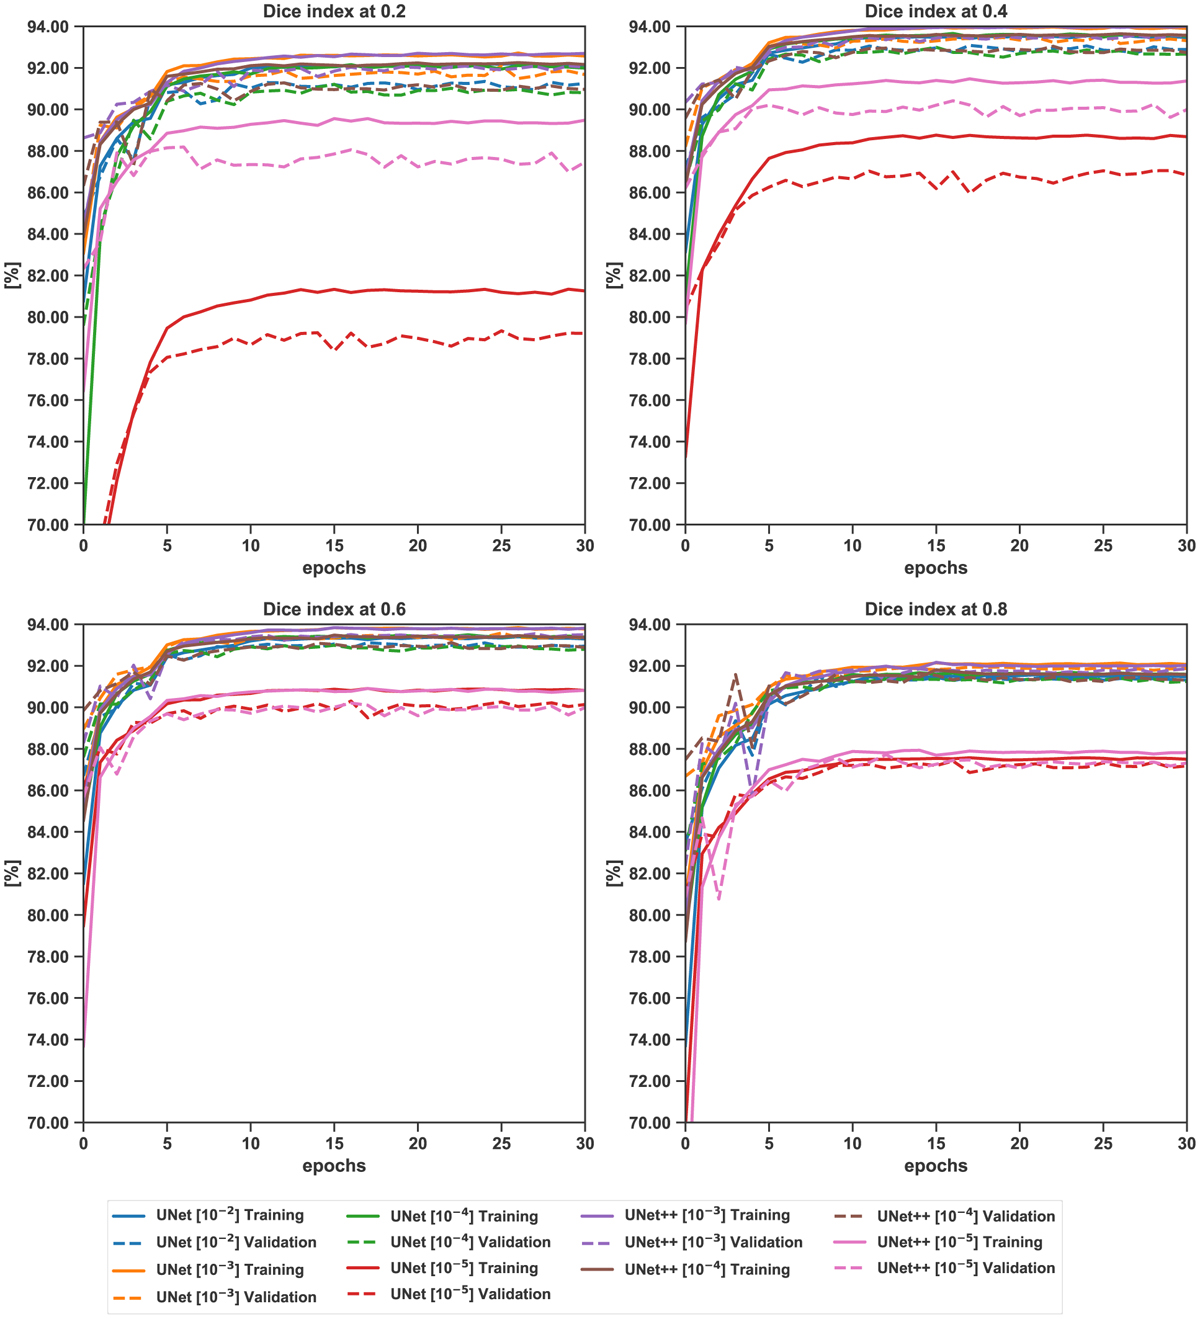
Dice curve evolution of schemes reported in Fig. 14 are displayed over the first 30 epochs in training (continued lines) and validation (dashed lines) steps, at classification threshold values 0.8, 0.6, 0.4, and 0.2. The displayed curves are aligned with the results deduced from BCE curves, where close performances were obtained with initial learning-rate values of 10−4,10−3, and 10−2, and a poorer performance is obtained for schemes with a learning-rate value of 10−5. The highest dice score is reported for UNet++[10−3] (purple), and the lowest performance corresponds to the UNet[l0−5] scheme, (red) especially at thresholds 0.2 and 0.4. Similar to the BCE curves and for all displayed schemes, a plateau regime is reached within the first ten epochs.
Current usage metrics show cumulative count of Article Views (full-text article views including HTML views, PDF and ePub downloads, according to the available data) and Abstracts Views on Vision4Press platform.
Data correspond to usage on the plateform after 2015. The current usage metrics is available 48-96 hours after online publication and is updated daily on week days.
Initial download of the metrics may take a while.