Fig. 13
Download original image
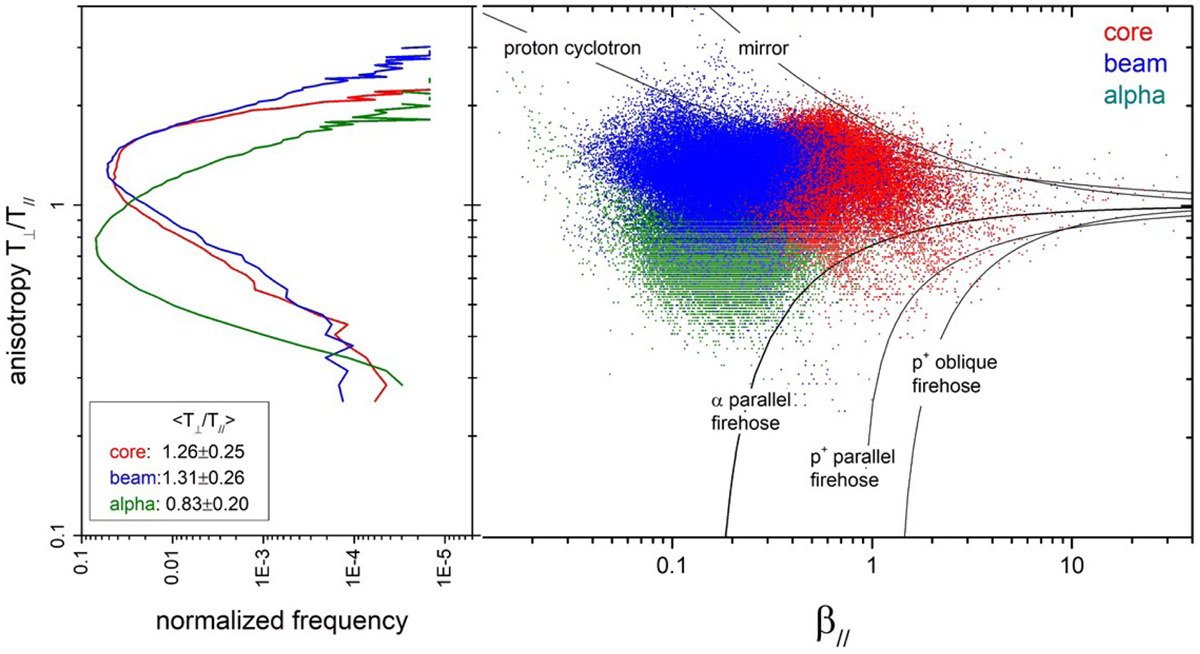
Histograms of the temperature anisostropies and instability plane. Left panel: normalized histograms of temperature anisotropy, defined as T⊥/T‖, for proton core (red line), proton beam (blue line), and alphas (green line). Right panel: temperature anisotropy vs. β‖, commonly known as instability plane for core (red), beam (blue), and alphas (green). Different solid lines indicate plasma instabilities: proton cyclotron and mirror for T⊥/T‖ > 1 and oblique firehose and parallel firehose for T⊥/T‖ < 1.
Current usage metrics show cumulative count of Article Views (full-text article views including HTML views, PDF and ePub downloads, according to the available data) and Abstracts Views on Vision4Press platform.
Data correspond to usage on the plateform after 2015. The current usage metrics is available 48-96 hours after online publication and is updated daily on week days.
Initial download of the metrics may take a while.