Fig. 6
Download original image
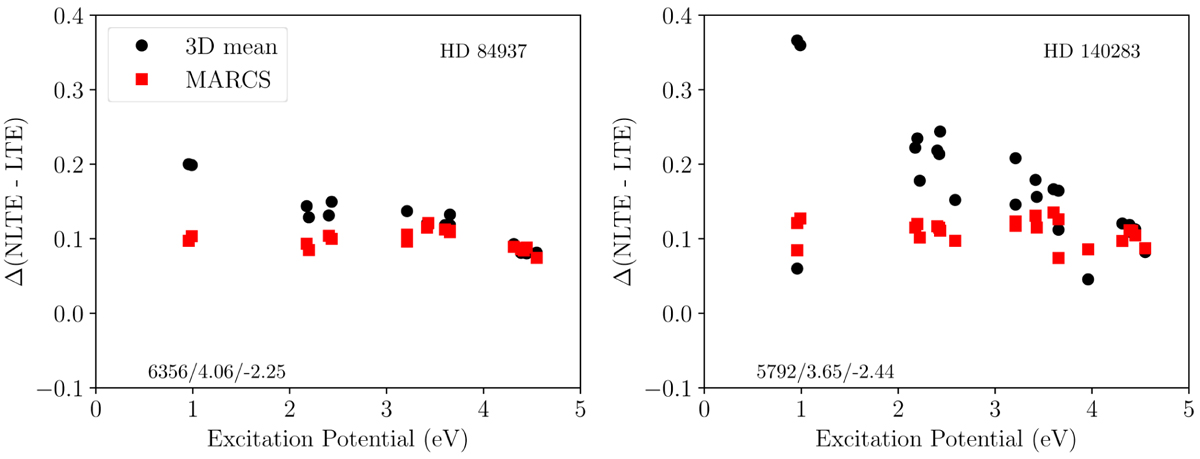
The difference between the line abundances derived from an NLTE and an LTE fit for both 〈3D〉 (Stagger) and MARCS model atmospheres for various Fe I lines, for HD 84937 and HD 140283, as a function of excitation potential of the line. Fits using MARCS model atmospheres are shown as red squares and those using 〈3D〉 model atmospheres are shown as black circles. The differences are given in units of dex.
Current usage metrics show cumulative count of Article Views (full-text article views including HTML views, PDF and ePub downloads, according to the available data) and Abstracts Views on Vision4Press platform.
Data correspond to usage on the plateform after 2015. The current usage metrics is available 48-96 hours after online publication and is updated daily on week days.
Initial download of the metrics may take a while.