Fig. 5
Download original image
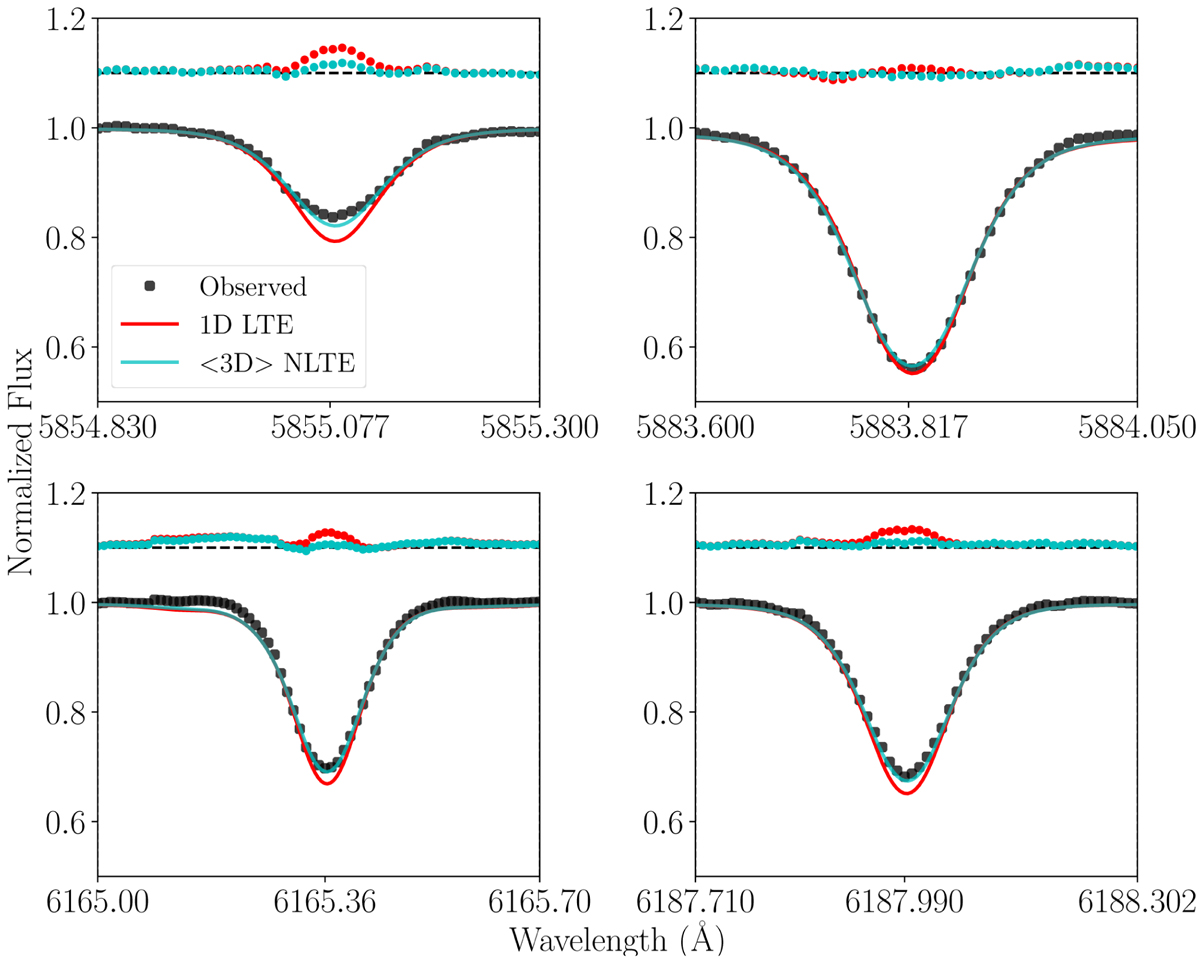
Normalized flux vs. wavelength for four sample Fe I lines in an observed solar spectrum, together with model fits. Observations are shown as black circles, 1D LTE model fits are shown as red lines, and 〈3D〉 NLTE model fits are shown as cyan lines. Residuals for the 1D LTE and 〈3D〉 NLTE model fits are shown as red and cyan points, respectively. The points have been shifted by 0.1 and are plotted above each spectrum with a dashed line to indicate the zero point at 1.1.
Current usage metrics show cumulative count of Article Views (full-text article views including HTML views, PDF and ePub downloads, according to the available data) and Abstracts Views on Vision4Press platform.
Data correspond to usage on the plateform after 2015. The current usage metrics is available 48-96 hours after online publication and is updated daily on week days.
Initial download of the metrics may take a while.