Open Access
Fig. 8
Download original image
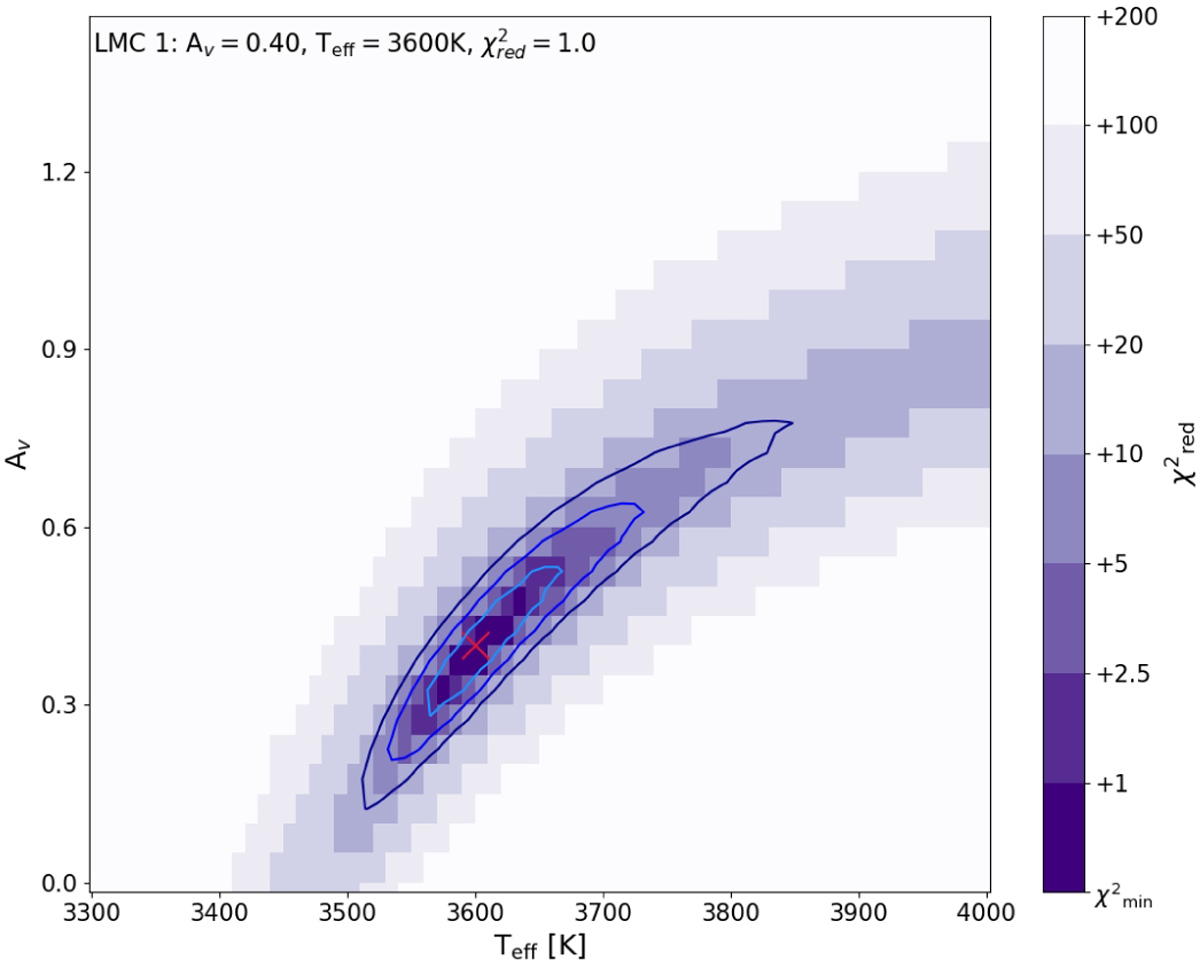
Map of AV and Teff for LMC1, with darker shades indicating parts of the grid with lower χ2 values. The χ2 values of the colour bar are with respect to the minimum χ2. Contours at 1σ, 2σ, and 3σ are indicated to estimate the uncertainties.
Current usage metrics show cumulative count of Article Views (full-text article views including HTML views, PDF and ePub downloads, according to the available data) and Abstracts Views on Vision4Press platform.
Data correspond to usage on the plateform after 2015. The current usage metrics is available 48-96 hours after online publication and is updated daily on week days.
Initial download of the metrics may take a while.