Fig. 7
Download original image
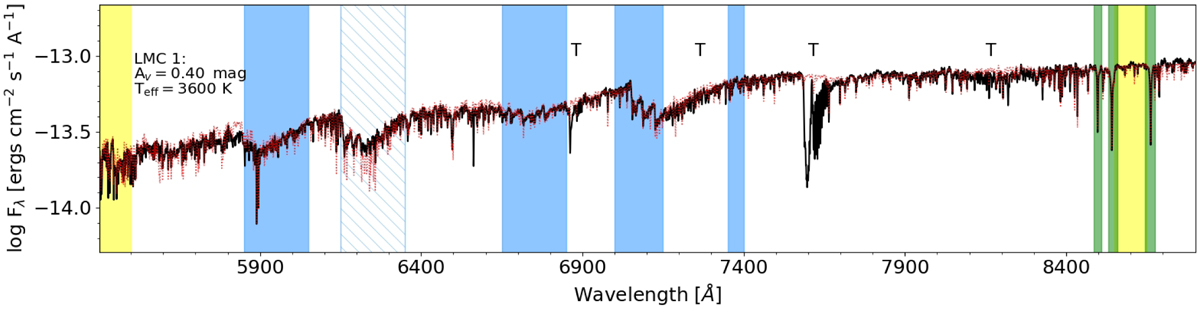
Best MARCS model fit (dotted red line) to the spectrum of LMC1 (solid black line). Regions included in the ![]() calculation are indicated with shaded areas. The best-fit properties are indicated in the top-left corner. Tellurics are indicated with a T, the Ca II triplet with green shades, the regions used for AV in yellow shades, and the TiO bands with blue shades. The TiO band at λ6150 (hatched) was excluded from the fit.
calculation are indicated with shaded areas. The best-fit properties are indicated in the top-left corner. Tellurics are indicated with a T, the Ca II triplet with green shades, the regions used for AV in yellow shades, and the TiO bands with blue shades. The TiO band at λ6150 (hatched) was excluded from the fit.
Current usage metrics show cumulative count of Article Views (full-text article views including HTML views, PDF and ePub downloads, according to the available data) and Abstracts Views on Vision4Press platform.
Data correspond to usage on the plateform after 2015. The current usage metrics is available 48-96 hours after online publication and is updated daily on week days.
Initial download of the metrics may take a while.