Open Access
Fig. A.5
Download original image
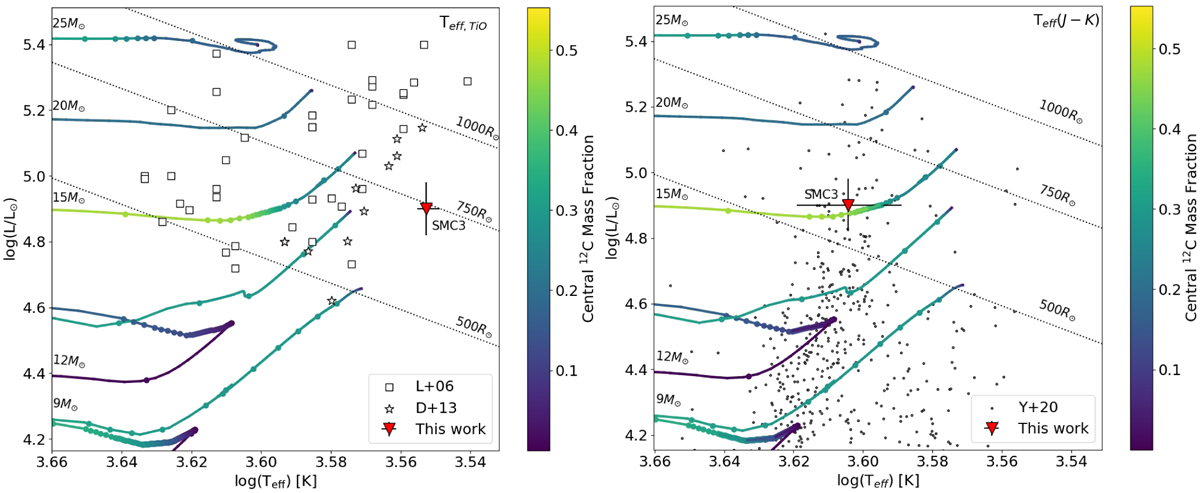
Locations of the RSGs in the SMC compared to evolutionary tracks. Left: Same as the top panel of Fig. 9 but for the SMC. Right: Same as the bottom panel of Fig. 9 but showing the general SMC RSG population from Yang et al. (2020) in the background.
Current usage metrics show cumulative count of Article Views (full-text article views including HTML views, PDF and ePub downloads, according to the available data) and Abstracts Views on Vision4Press platform.
Data correspond to usage on the plateform after 2015. The current usage metrics is available 48-96 hours after online publication and is updated daily on week days.
Initial download of the metrics may take a while.