Fig. 1
Download original image
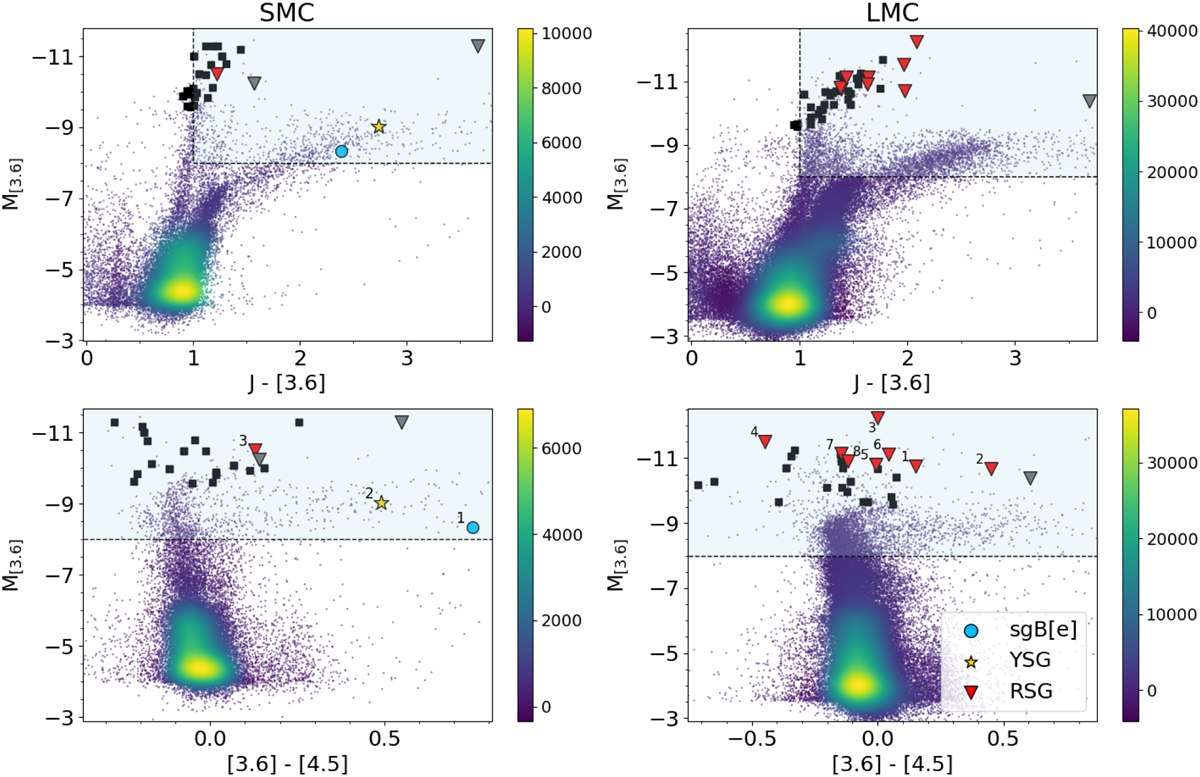
CMDs for the SMC (left) and LMC (right). The background points are sources from the catalogues used for target selection (Yang et al. 2019, 2021). The colour bar indicates the number density of the stellar population. We show RSGs classified by Levesque et al. (2006) in black. Inverted grey triangles indicate contaminating objects that were observed (i.e. SMC4, SMC5, and LMC9). Our final sample is shown using the coloured symbols indicated by the legend. Top: M[3.6] vs. J − [3.6] CMD, highlighting the criteria used to select supergiant stars with the blue shaded region. In the panel on the right, seemingly only seven inverted red triangles are plotted, which is due to the nearly identical position of LMC1 and LMC5. Bottom: M[3.6] vs. [3.6]–[4.5] CMD to visually inspect the locations of the objects using IRAC bands. The numbers correspond to the object IDs of the verified supergiants.
Current usage metrics show cumulative count of Article Views (full-text article views including HTML views, PDF and ePub downloads, according to the available data) and Abstracts Views on Vision4Press platform.
Data correspond to usage on the plateform after 2015. The current usage metrics is available 48-96 hours after online publication and is updated daily on week days.
Initial download of the metrics may take a while.