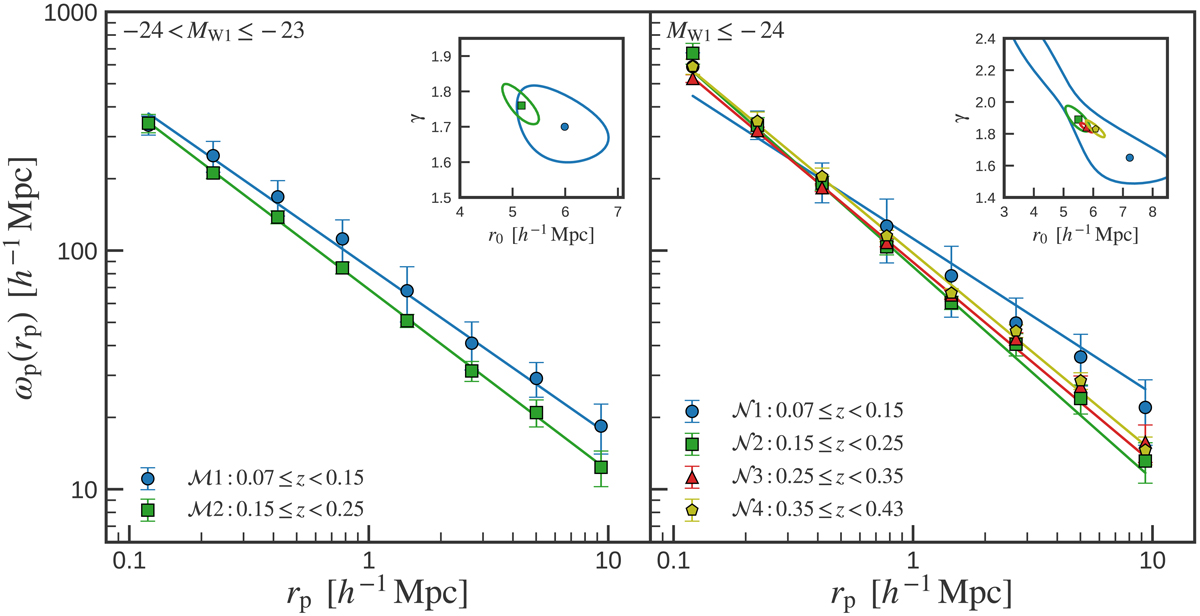
Fig. 6.
Download original image
Projected two-point correlation functions corresponding to different redshift bins (as labelled) in the magnitude ranges −24 < MW1 ≤ −23 (left panel) and MW1 ≤ −24 (right panel). The insets show the best fitting power-law parameters with 1σ error contour. The error bars on the markers are the square root of the diagonals of the covariance matrix obtained from the jackknife resampling method.
Current usage metrics show cumulative count of Article Views (full-text article views including HTML views, PDF and ePub downloads, according to the available data) and Abstracts Views on Vision4Press platform.
Data correspond to usage on the plateform after 2015. The current usage metrics is available 48-96 hours after online publication and is updated daily on week days.
Initial download of the metrics may take a while.