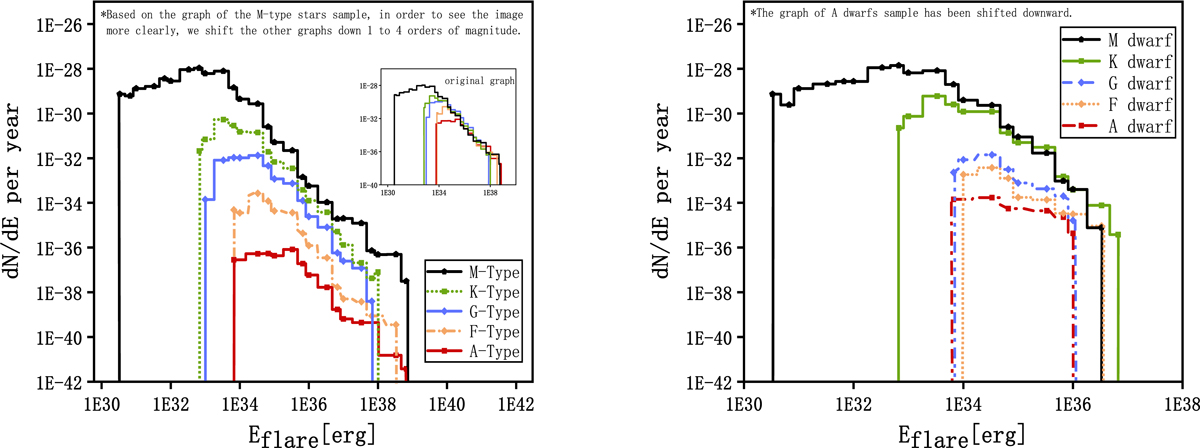
Fig. 20.
Download original image
Comparison between FFDs of different spectral types. Left panel is the cumulative FFD of all flare events, where different types and color lines represent the different spectral types. Meanwhile we shifted the original graphs in the vertical direction to make graphs more clear and easier to be compared. The right panel is the corresponding cumulative FFD of flare events for all dwarf samples.
Current usage metrics show cumulative count of Article Views (full-text article views including HTML views, PDF and ePub downloads, according to the available data) and Abstracts Views on Vision4Press platform.
Data correspond to usage on the plateform after 2015. The current usage metrics is available 48-96 hours after online publication and is updated daily on week days.
Initial download of the metrics may take a while.