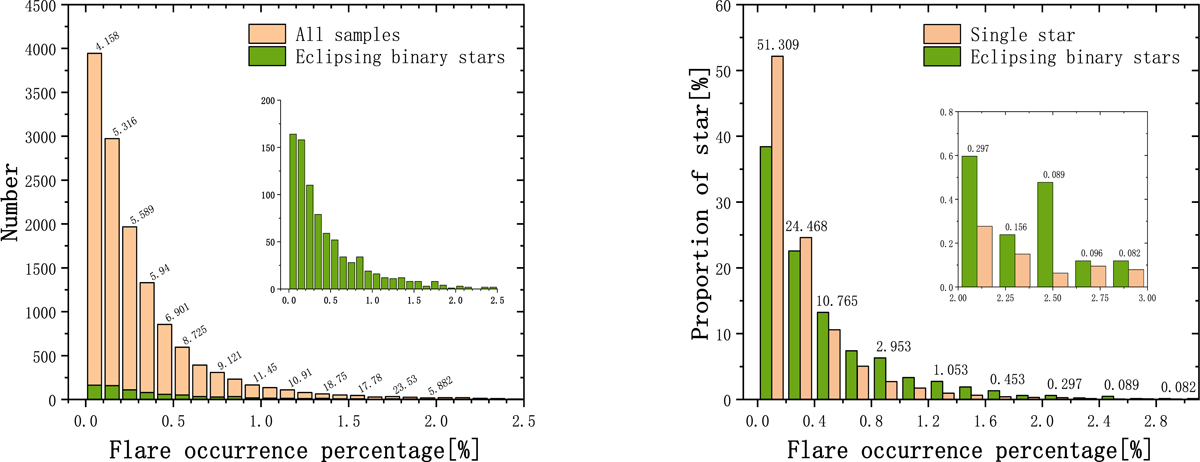
Fig. 15.
Download original image
Distributions of occurrence percentage for each flaring star. Left panel: the yellow part is the distribution of occurrence percentage of all flare events, and the green part is of eclipsing binaries. The number above the bar graph represents the percentage of the eclipsing binaries and all samples in the corresponding X-axis interval. Right panel: the abscissa in the right panel is still the occurrence percentage of each flaring star, and the yellow part is the ratio of flaring single stars to all single stars within the abscissa range. The green part is the same but for eclipsing binaries. The number above the bar chart is the proportion of stars in this abscissa range in all our samples.
Current usage metrics show cumulative count of Article Views (full-text article views including HTML views, PDF and ePub downloads, according to the available data) and Abstracts Views on Vision4Press platform.
Data correspond to usage on the plateform after 2015. The current usage metrics is available 48-96 hours after online publication and is updated daily on week days.
Initial download of the metrics may take a while.