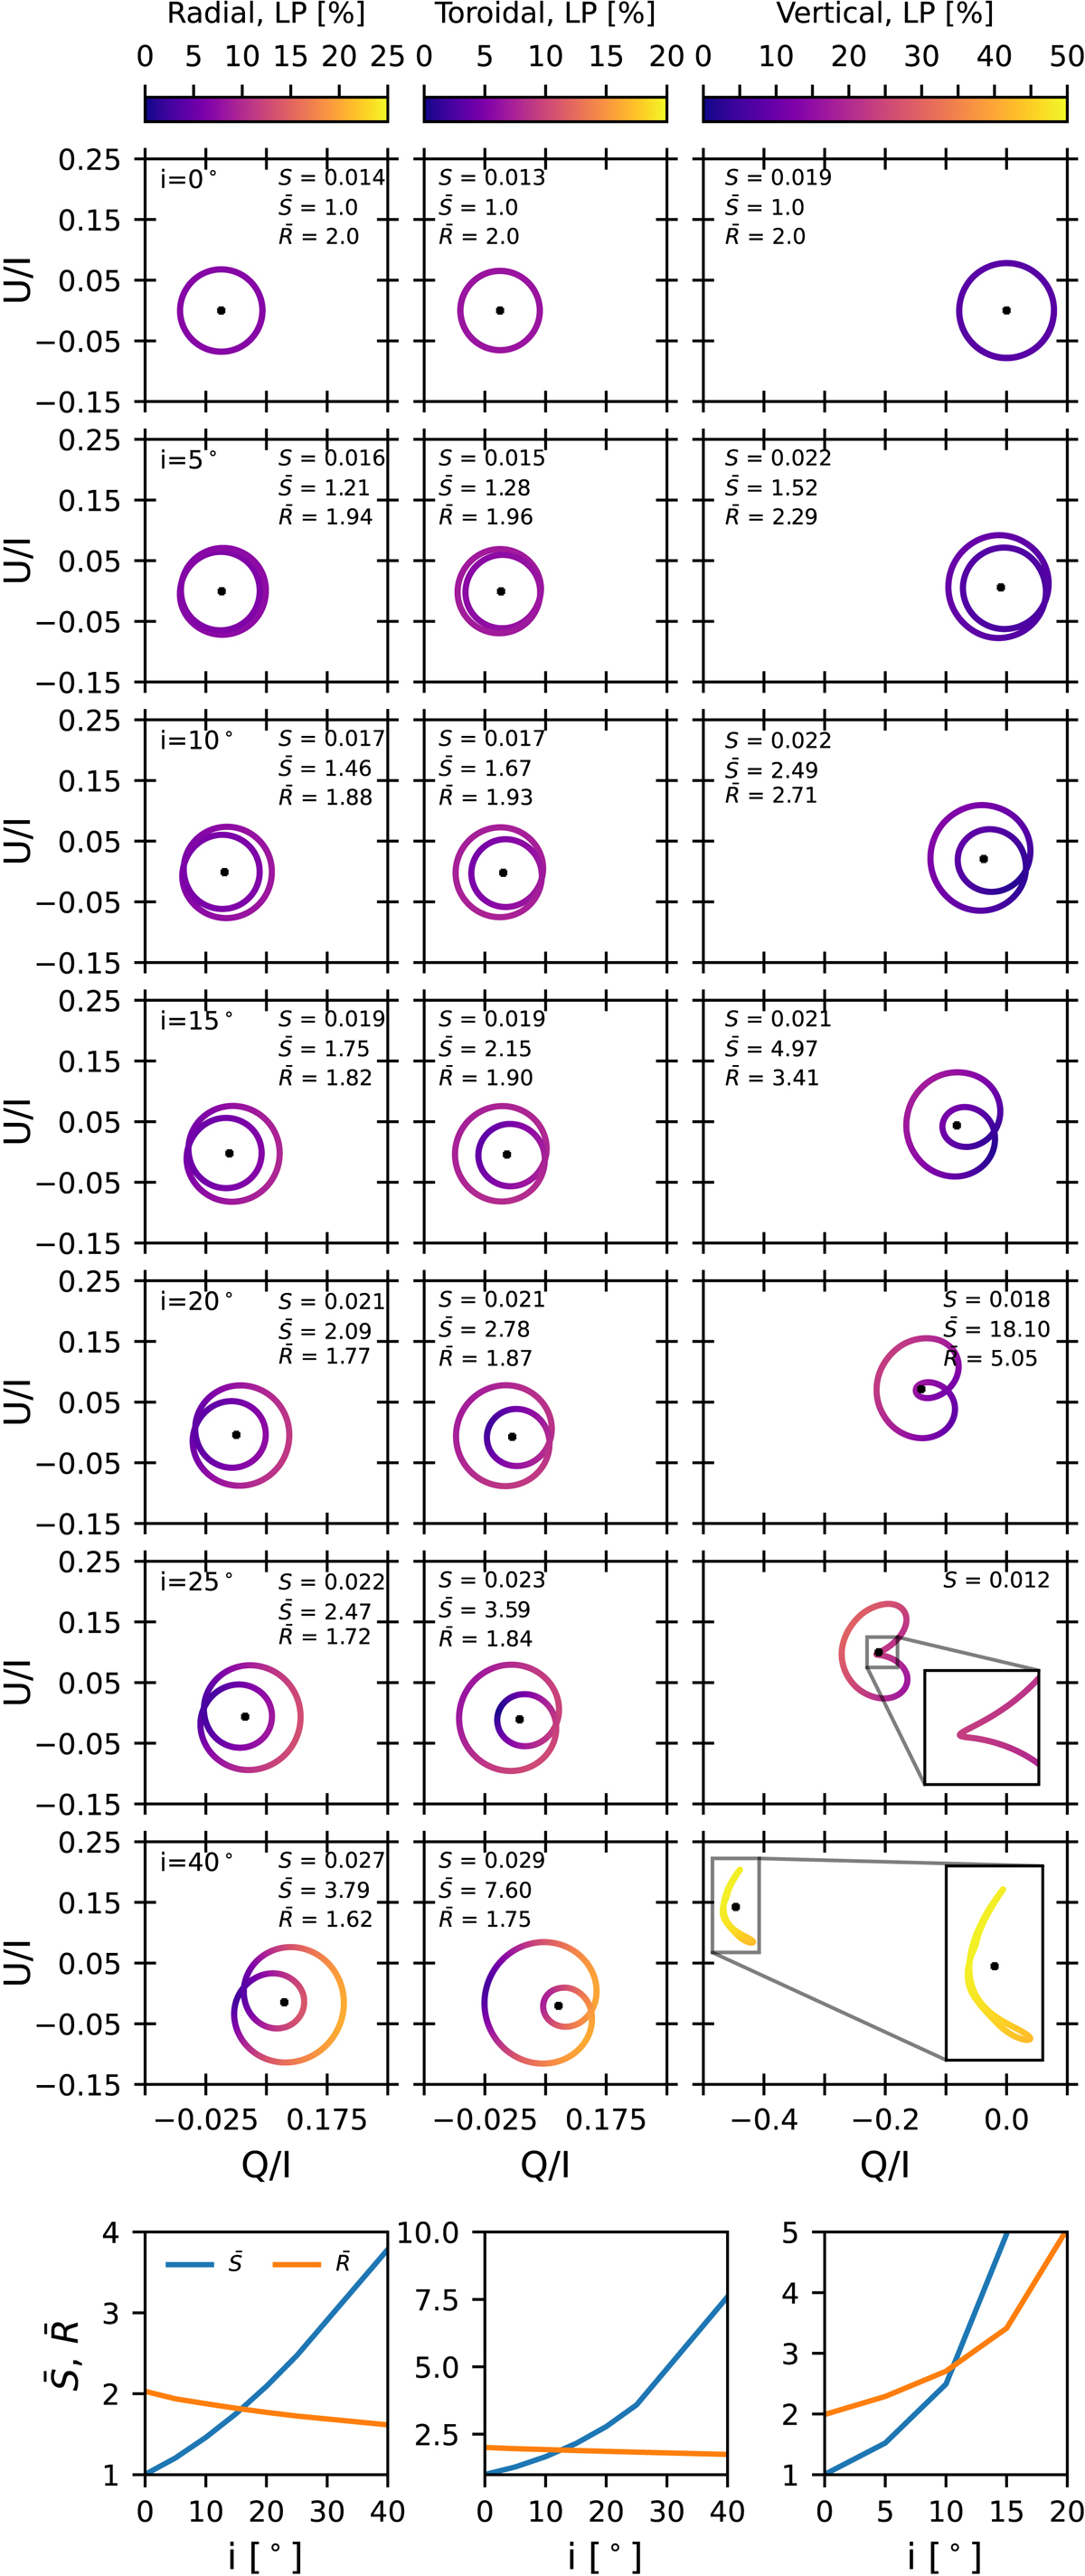
Fig. 7.

Download original image
Normalized 𝒬 − 𝒰 diagrams of the full model, colored according to their LP fraction as a function of increasing inclination i (panels from top to bottom). Each column corresponds to a different magnetic field configuration. All models have a* = 0. While for the vertical magnetic field, the 𝒬 − 𝒰 loops disappear for i ≳ 25°, for other field geometries, they are present for all viewing angles, except exact edge-on cases (see also Fig. 5). The bottom row shows the behavior of ![]() (in blue) and
(in blue) and ![]() (in orange) as a function of inclination i. The observables S,
(in orange) as a function of inclination i. The observables S, ![]() , and
, and ![]() are explained in Fig. 6.
are explained in Fig. 6.
Current usage metrics show cumulative count of Article Views (full-text article views including HTML views, PDF and ePub downloads, according to the available data) and Abstracts Views on Vision4Press platform.
Data correspond to usage on the plateform after 2015. The current usage metrics is available 48-96 hours after online publication and is updated daily on week days.
Initial download of the metrics may take a while.


